A realistic crypto signal win rate is whatever the payoff allows. A service targeting 1–3% moves with a short hold can honestly reach 85–95% target hits, because each miss is allowed to cost ten times a win. A swing service with a stop can honestly reach 45–65%. A trend-follower, 30–45%. The number on its own says nothing; the number next to the average loss says everything. This article shows the arithmetic on 33,694 of our own published signals, misses included.
Why a win rate on its own is not a number
Every trader has been shown a 90%+ win rate at some point, and most have learned to be suspicious of it without being able to say why. The reason is that a win rate is one of two inputs to the only figure that matters, and the other input is usually missing.
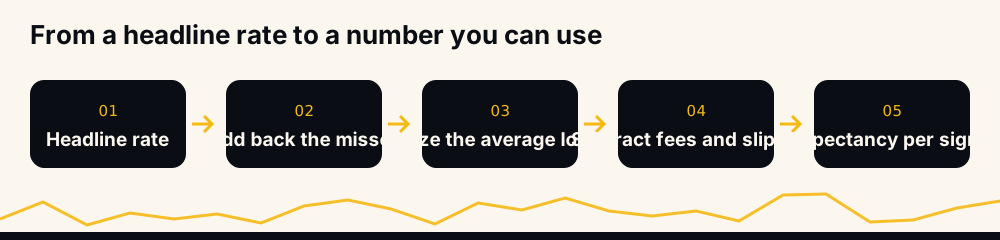
The figure is expectancy: what one signal is worth, on average, before sizing. Written out:
Expectancy = p × W − (1 − p) × L
where p is the win rate, W the average win and L the average loss, all in the same units. A 98% rate with 1% wins and 60% losses is a losing strategy (0.98 − 1.2 = −0.22 per signal). A 40% rate with 6% wins and 2% losses is a good one (2.4 − 1.2 = +1.2). The rate that sounds like a scam is fine and the rate that sounds like a miracle loses money. No amount of staring at p alone tells you which is which; that is why we wrote a separate guide on how to verify a crypto signal win rate before paying for one.
The break-even line: what a 98% rate actually needs
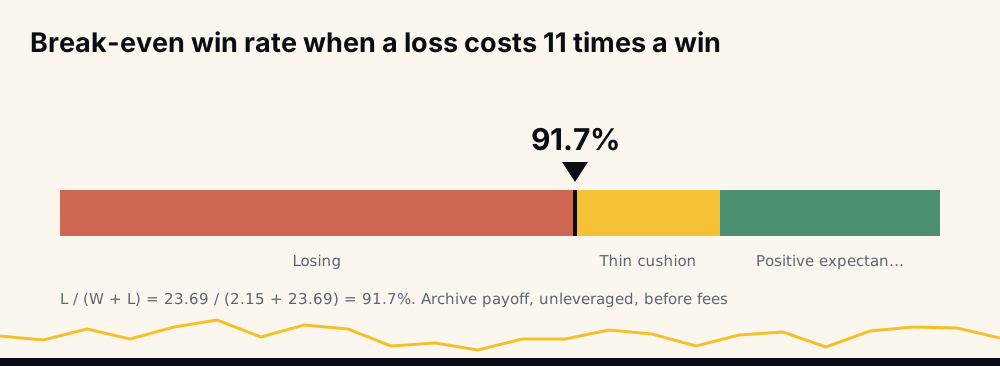
Rearranging the same formula gives the win rate at which a strategy stops losing money:
Break-even p = L ÷ (W + L)
This is the number to hold any claim against. If wins and losses are the same size, break-even is 50%. If a loss is twice a win, 67%. If a loss is eleven times a win, 91.7%. So a service that quotes 98% has not proven anything until it tells you how big its misses are; with an eleven-to-one loss, 98% is a six-point cushion, not a licence to print.
Those are not hypothetical numbers. They are ours.
Our own archive: 98.2%, and what the other 1.8% cost
Between June 2021 and February 2024 we published 33 monthly spreadsheets listing every signal sent — 33,694 rows, now also available as one downloadable dataset. Of those rows, 33,081 are marked closed and 613 are marked open. Under the accounting those sheets used, a row closed only when the target was reached, so the closed share is the target-hit rate: 98.2%.
The closed rows are modest. Median move +1.48%, mean +2.15%, the 90th percentile +3.68%. These are tight-target signals, and 98% of the time price got there.
The 613 open rows are the other half of the story. They are signals still running when the month's sheet was cut, carrying a mark-to-market snapshot instead of a result: median −18.95%, mean −23.69%, and 80% of them worse than −10%. Nobody would call these wins; the sheets simply had no column to call them losses.
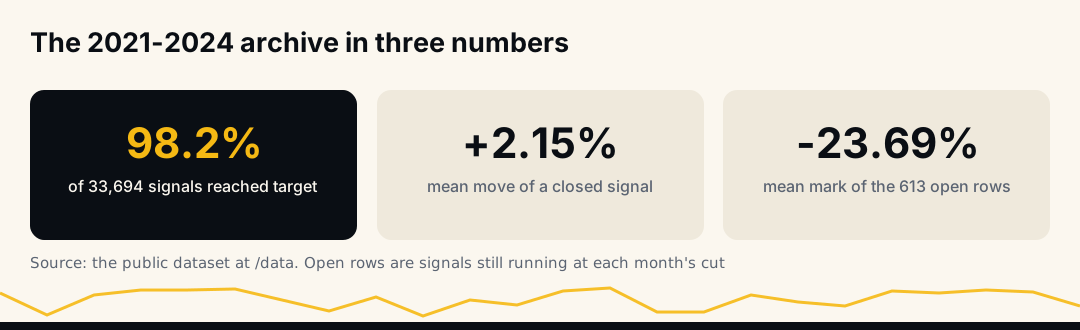
Put the two halves into the formula. Gross gain from closed rows: 33,081 × 2.15 ≈ 71,100 percentage points. Gross give-back from open rows: 613 × 23.69 ≈ 14,500. The 1.8% of signals that never arrived consumed a fifth of everything the other 98.2% earned. Expectancy per signal, unsized and before fees, works out to about +1.7 points — positive, but the cushion is the six points between 98.2% and the 91.7% break-even, not the ninety-eight.
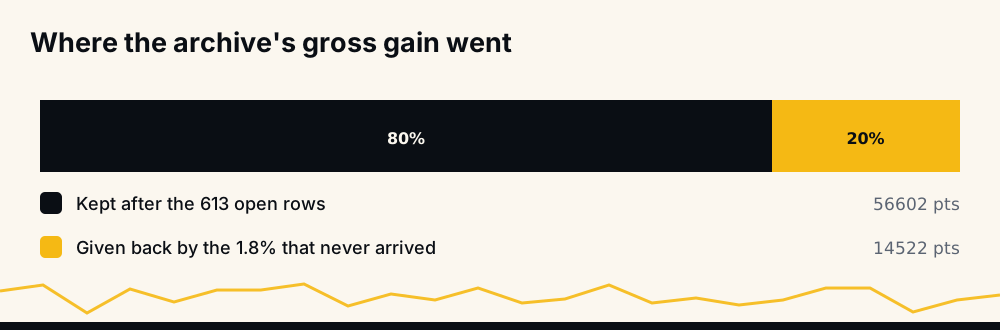
That is what a realistic 98% looks like from the inside: a high rate, small wins, and a thin tail of large misses that a headline never shows.
What a −179% row teaches
The worst open row in the file is a short marked at −179.84%. A short position loses more than 100% when the coin more than doubles against it, which one did. It is worth pausing on, because it is the concrete form of an abstract point: for a tight-target strategy, the loss distribution has no natural floor unless a stop imposes one. Longs are capped at −100%; shorts are not capped at all.
The archive carries 29,296 longs and 4,398 shorts across 277 symbols. The asymmetry matters when you size: a rate computed across both sides is dominated by the longs, while the worst tail sits in the shorts.
The same signals under a stricter rule: 97% to 98%
Since June 2026 the live performance page has scored signals from the trade database directly, and it uses a stricter rule. A win is a target hit. A signal that reaches its maximum hold without hitting its target is counted as Missed, and it counts against the rate.
Under that rule the settled 2026 months read 98.4% (June, 6,304 signals), 97.2% (July, 5,448) and 97.3% (August, 5,262); September is still settling. From 3 October 2026 signals have longer to reach their target before they count as expired, and on 4 October 2026 every earlier month was scored again under the same hold, so all months follow one rule. Under the shorter hold used before, the same three months read 94.3%, 88.3% and 91.0%. Expiries now run between 1.6% and 2.8% of signals in each month — the same kind of stalled trade that the 2021 sheets left sitting in an open row, now named and counted. We explain the mechanics in what happens when a crypto signal expires.
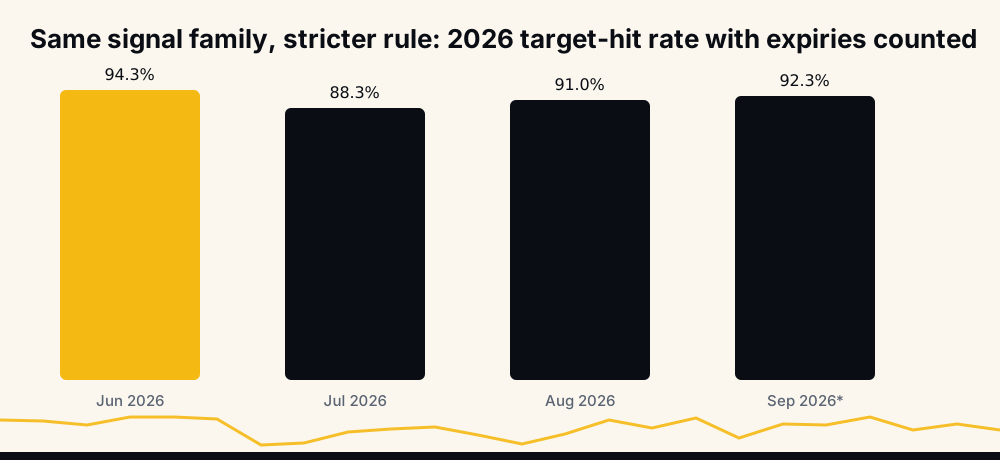
One caveat the page itself states: broadcast signals carry no stop-loss, so there is no losses column; every signal that does not reach its target in time is counted as Missed, against the rate. The absence of losses is how the record is built, not a claim.
How the counting rule and the hold move the number
Nothing about the signals changed between the two records. The rule did. Closed-over-all-rows gives 98%; wins-over-everything-resolved gives roughly 97% under the current hold, and gave roughly 90% under the shorter hold used until October 2026. A reader comparing two providers is very often comparing two accounting rules, which is why the same trades can carry four different win rates depending on who counts them.
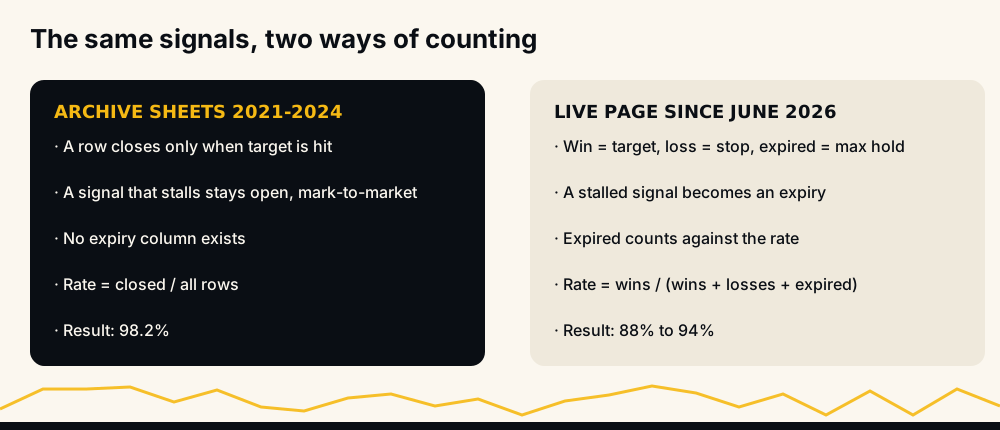
The habit to build is to ask, before the number, what is a win here, and where did the signals that did nothing go? A provider who answers both in one sentence usually has a record. One who answers with a screenshot usually does not.
Realistic ranges by signal style
With the formula in hand, the honest range for each style follows from its payoff, not from marketing. The table below is arithmetic, not a survey: each row states the hit rate a style can reach without the losses overwhelming the wins.
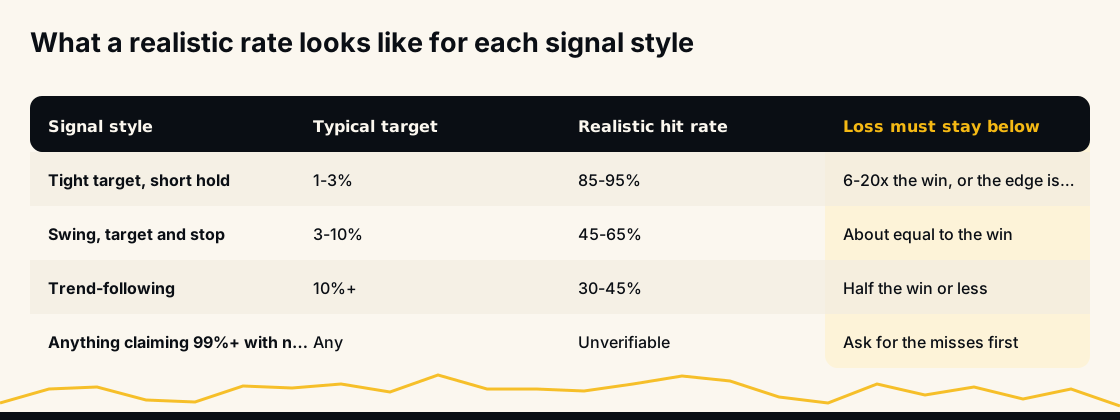
- Tight target, short hold (the archive's style): 1–3% targets, most reached within hours. 85–95% is realistic provided the average miss stays under roughly ten to twenty wins. Above 95% sustained, ask to see the misses; our own 33-month median was 98.9% as reported in those sheets, on the lenient rule and 97–98% on the strict one under the current hold.
- Swing signals with a stop: 3–10% targets, days to weeks. 45–65% is the honest band, because a stop at roughly the same distance as the target makes wins and losses similar in size and break-even sits near 50%.
- Trend-following: targets of 10% and more, held for weeks. 30–45% is normal and profitable when winners run to two or three times the loss.
- Anything at 99%+ with no misses shown: unverifiable. Our own record is the argument — even a genuinely high-rate strategy produced a −179% row.
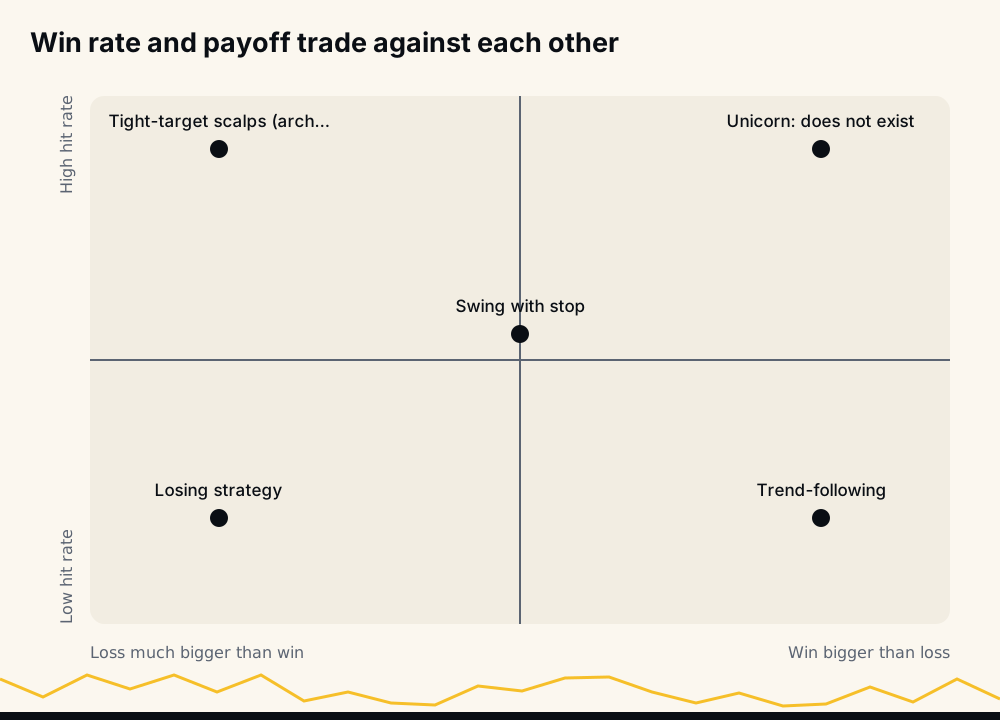
The quadrant nobody occupies is the top right: high hit rate and wins bigger than losses. Every honest record sits on the diagonal. A claim that sits off it is either a very small sample or a very selective one.
Does signal strength change the rate?
Each HafizeBot signal carries a strength rating, and the archive lets us check whether it means anything for the hit rate. It does, slightly and consistently: unrated rows (the earliest months) closed at 95.2%; strength 0 at 98.5%; strength 1 at 98.9 percent; strength 2 at 99.1%; strength 3 at 99.3%. Strength 4 fired 108 times and closed at 97.2%, a small enough sample that the dip is noise. Strength 5 fired once.
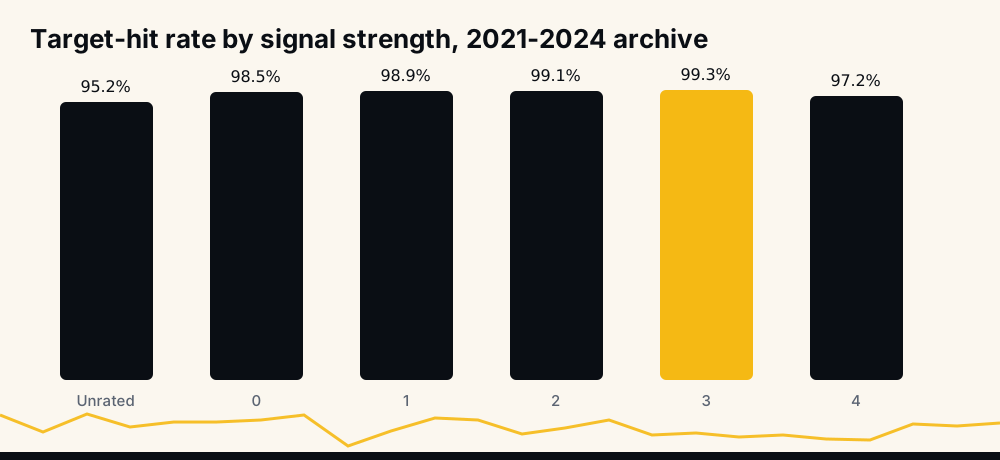
The more important number is the count. Strength 3 and above is 3.7% of the archive. A filter that only takes high-strength signals raises the rate by well under a point and cuts the number of trades by twenty-five times — which is why a realistic rate has to be read against sample size as well as payoff.
How fast wins arrive, and why that flatters the rate
Half of all closed rows in the archive reached target in under 1.1 hours. A quarter took under twelve minutes. Only 8.5% ran past three days.
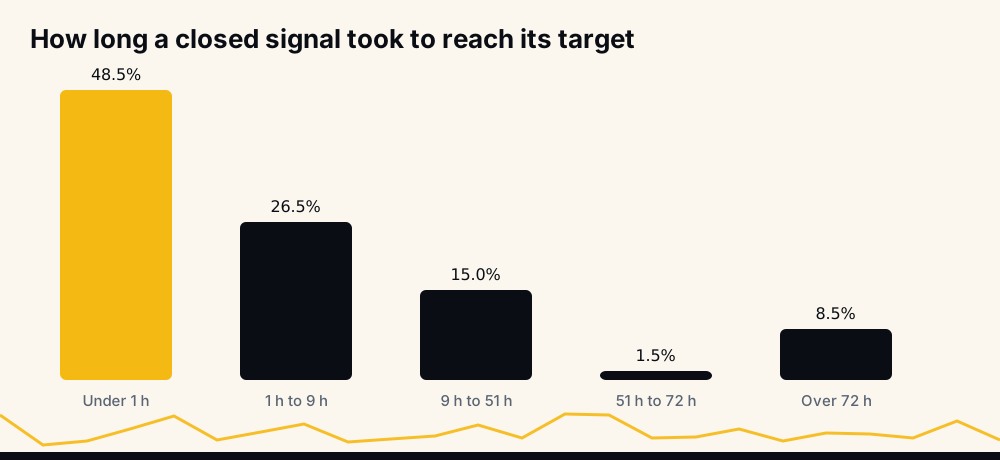
Fast wins are why the tight-target style scores so high and why its rate is so easy to misread. Price touches a 1.5% target within the hour in most conditions; it is the signals that do not touch it in the first hour that go on to become the open rows, and those are exactly the ones a lenient rule leaves out. A rate is only realistic if the slow signals are inside it.
From the provider's rate to your rate
Whatever the record says, your own result will differ, and it differs in a predictable direction. Fees on Binance USDT-M perpetuals take a few hundredths of a percent per side; on a +1.48% median win that is a visible bite, and on a signal that expires flat it is the whole result. Slippage on a market entry costs another fraction. And on the free channel the signal arrives twenty minutes after VIP, which on a signal whose median life is 66 minutes is a material share of the move.
None of that changes the win rate. All of it changes the expectancy, which is the point: two people following the same 97% record can finish a month on different sides of zero. Why your results differ from the signal provider's walks through each gap; how to read a crypto signal covers what the entry, target and strength fields mean before you act on them.
Turning any claimed rate into a realistic one
Six questions convert a headline into something you can put in the formula.
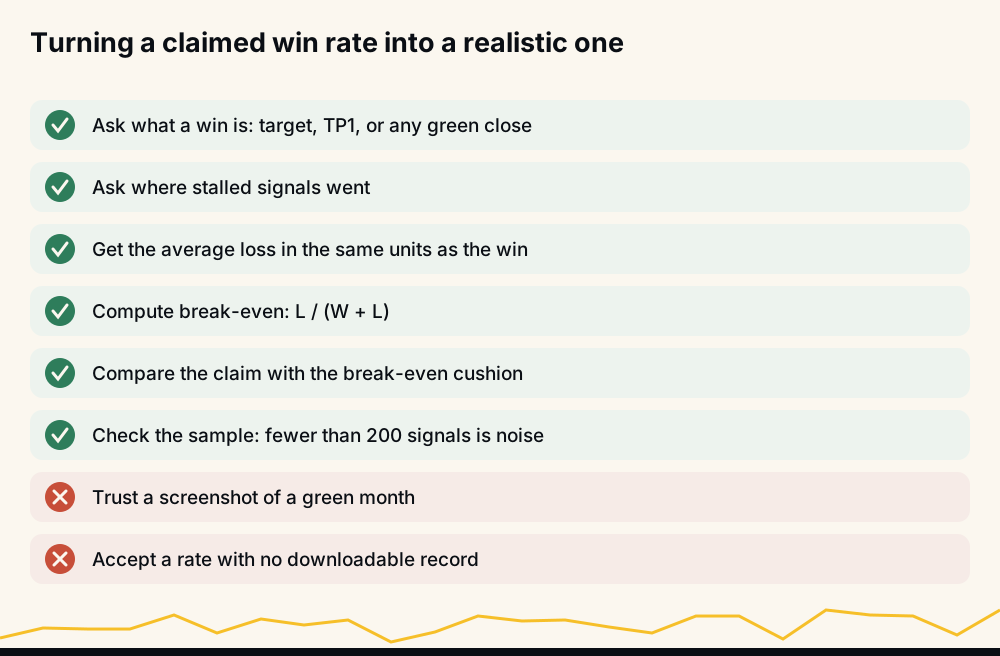
- What is a win? Target reached, first partial target, or any green close.
- Where did the stalled signals go? Counted, dropped, or left "open".
- What is the average loss, in the same units as the win? If the answer is a shrug, assume the worst tail you have seen — ours is −179%.
- What is break-even? L ÷ (W + L). Write it down next to the claim.
- How big is the cushion? Claimed rate minus break-even. Under five points is thin; under zero is a losing service dressed as a winning one.
- How large is the sample? Under 200 signals, the rate is weather. The archive's monthly rate moved between 92.4% and 100% on samples of 326 to 2,578.
Then ask for the file. The record that makes this article possible is downloadable and nobody needed to trust us to compute any number in it. A provider who cannot produce the equivalent is asking you to take the rate on faith, and faith is not one of the inputs to expectancy. For the fuller picture of what those 33 files contain, see what 33,694 published trades did.
Frequently asked questions
What is a good win rate for crypto signals? There is no good rate without the payoff. For tight-target signals, 85–95% with small misses is good; for swing signals with a stop, 45–65%; for trend-following, 30–45%. A rate is good when it sits comfortably above L ÷ (W + L), the break-even for that payoff.
Is a 90% crypto signal win rate realistic? Yes, for signals with targets of 1–3% and short holds, and our own published record shows 97–98% for its settled months under a strict counting rule, and 88–94% under the shorter hold it used until October 2026. It is realistic only alongside a loss tail that can run to ten or more times a win; without that tail being shown, 90% is a claim, not a result.
Is a 98% win rate possible? On a lenient rule that counts a close only at target and leaves stalled signals aside, yes — our 2021–2024 sheets show 98.2%. On a rule that counts expiries against the rate, the same signal family scores roughly 97% under the current hold, and scored roughly 90% under the shorter one used until October 2026. Ask which rule before believing which number.
How do you calculate the break-even win rate? Divide the average loss by the sum of the average win and the average loss: L ÷ (W + L). With a 2.15% average win and a 23.69% average loss, break-even is 91.7%.
Why do signal providers not show their losses? Because a rate without losses is higher, and because many records have no field for a signal that simply went nowhere. The live performance page counts expired signals against the rate for exactly that reason.
How many signals are needed before a win rate means anything? A few hundred at minimum. In the archive, monthly samples of 300 to 2,600 signals produced rates that ranged from 92.4% to 100% for the same strategy; a rate quoted from a few dozen trades is noise.
Does a higher win rate mean more profit? No. Profit per signal is p × W − (1 − p) × L. Raising p while L grows faster produces a worse result, which is how a 98% strategy with an unmanaged tail can trail a 45% strategy with a stop.
Closing note
A realistic crypto signal win rate is one that arrives with its average loss, its counting rule and its sample size attached. Ours, stated that way: 98.2% of 33,694 signals reached a median +1.48% target, the 1.8% that did not averaged −23.69%, and under a stricter rule the live record's settled months run 97–98%. Any provider can be described in the same sentence. The ones who will not be are the ones to walk past.
None of this is investment advice. Cryptocurrency futures carry a high risk of loss; trade only with money you can afford to lose. See what financial risk means before sizing any position.