Financial risk is the possibility that money you have committed comes back smaller than it went out, or does not come back at all. For a crypto trader it is not one thing but five: market risk, leverage risk, liquidity risk, counterparty risk and operational risk. Each arrives through a different door, and each is managed differently — sizing handles one, custody handles another, and no single stop-loss handles all of them.
Textbook definitions of financial risk are written for a treasurer worrying about a bond covenant. They are accurate and almost useless at the screen. What follows is the trader's version: which risks can actually reach a Binance futures account, what each one is worth in percentage terms, and where the arithmetic that keeps you solvent is done.
The five financial risks that reach a trading account
A company classifies financial risk into market, credit, liquidity and operational buckets. A leveraged crypto trader inherits three of those, swaps credit risk for counterparty risk — you are not lending, you are depositing — and adds leverage risk, which is really market risk with a deadline attached.
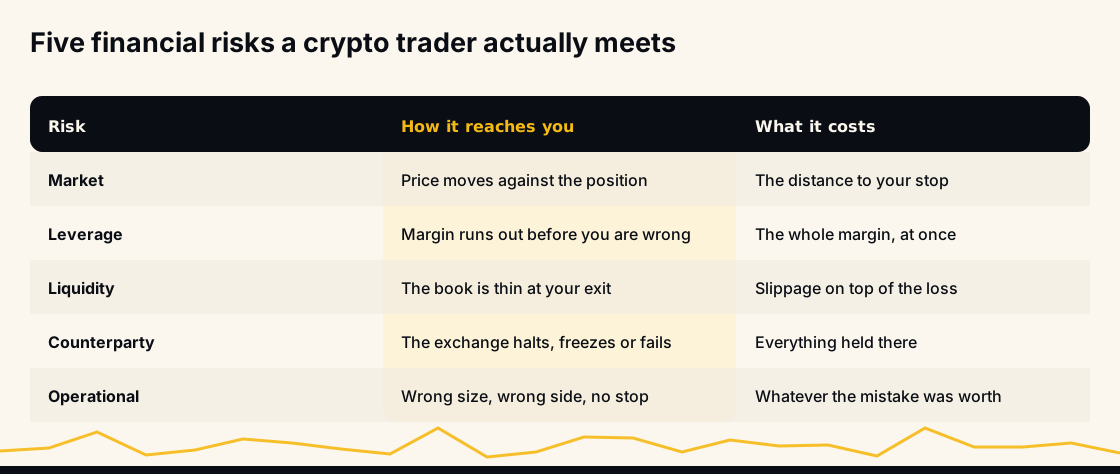
The order matters. Traders spend almost all their attention on the first row and lose accounts to the second, third and fifth. The one that ends careers is rarely the trade that went wrong; it is the size the trade was allowed to be.
Market risk: the price simply goes the other way
Market risk is the plain one. You buy, price falls; you short, price rises. It is unavoidable — it is the thing you are being paid to take — and it is the only risk on this list that you deliberately want exposure to.
What makes it manageable is that it is continuous. Price walks through levels on its way to hurting you, which is why traders bother with structure at all: a level that invalidates the idea gives you a place to stand. If you have never formalised that, support and resistance in cryptocurrency analysis is the vocabulary for it, and the five main indicators used in technical analysis are the common ways of reading the same chart.
Market risk becomes something else entirely when the market gaps. Crypto trades every hour of every day, so it gaps less than equities do at the open — but a weekend liquidation cascade produces the same effect: the next price is far below the last one, and nothing traded in between.
Leverage risk: running out of margin before you run out of being right
Leverage does not change your directional view. It changes how much room that view is allowed. At 10x, roughly a 10% adverse move exhausts the margin behind an isolated position; at 20x, roughly 5%; at 50x, roughly 2%, before fees and the maintenance margin requirement, which both make the real number slightly worse.
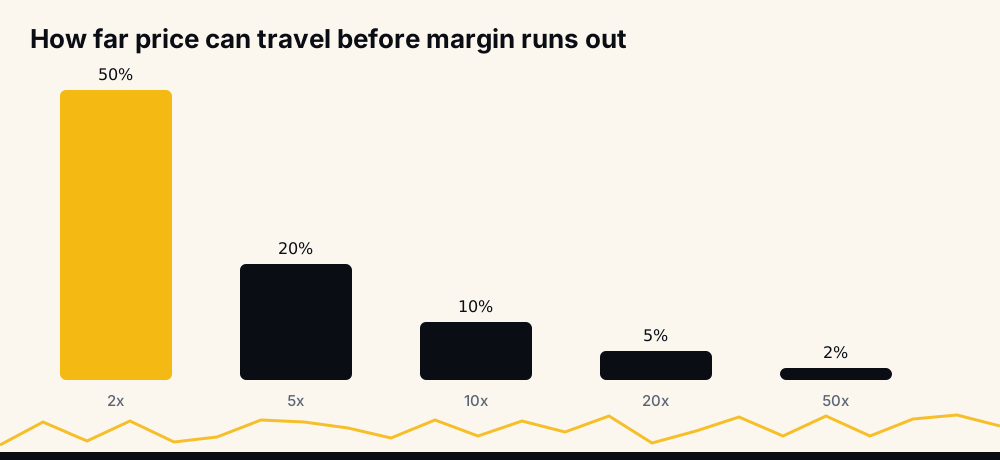
Divide 100 by the leverage and you have the approximation. It is worth internalising because it reframes the choice: picking leverage is picking how large a normal, boring, entirely expected wiggle has to be before you are removed from a trade you were eventually right about. Bitcoin routinely moves 2% in an afternoon. A 50x position is a bet that it will not do so in the wrong direction first.
Liquidation is also the only loss on this list that is not capped by your stop, because it arrives before your stop. If you trade both directions, the mechanics of margin, funding and forced closure are covered in the long and short position in the crypto market.
This entire category is optional. Buy the coin outright on the spot market and there is no margin to exhaust, no funding to pay and no liquidation price at all — you keep the asset through the drawdown and only market risk remains. Leverage is a choice to trade time pressure for size, and it should be made deliberately rather than inherited from an exchange's default setting.
Liquidity risk: the exit is not where the screen says it is
Liquidity risk is the gap between the price you see and the price you get. It is invisible in backtests and in screenshots, and it shows up precisely when you most need out: during the fast move, in the thin altcoin, at 4am on a Sunday.
Two things drive it. The first is size relative to the order book — if your exit is larger than the resting bids within a few ticks, you eat through them and take a worse average. The second is volatility, which widens spreads and pulls market makers back. Slippage, and why a buying and selling difference occurs explains the mechanism in detail.
Practically: liquidity risk is why the same strategy that works on BTCUSDT can quietly bleed on a pair with a tenth of the depth, and why "my stop was at that level" and "I got filled at that level" are two different claims.
Counterparty risk: the venue is a company, not a law of nature
When your coins sit on an exchange, you own a claim on that company, not the asset. Withdrawals can be paused, a chain can be delisted, an API can go down mid-position, an entire venue can fail. None of that is priced into your stop-loss.
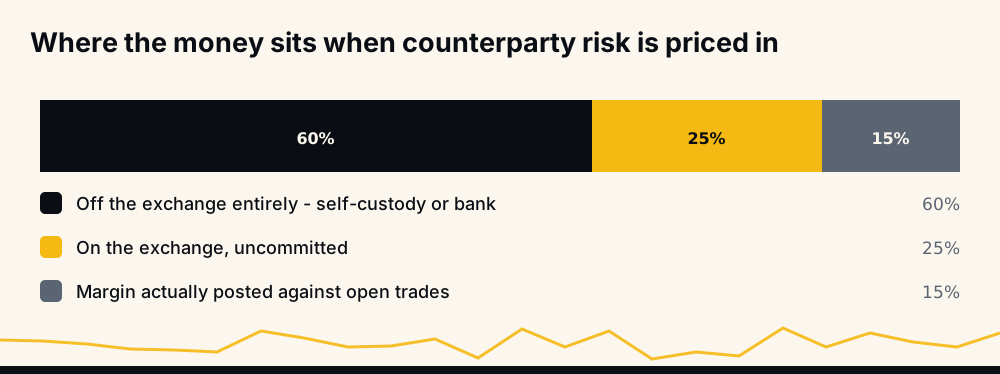
The only real defence is not keeping everything in one place. The split above is illustrative, not a prescription, but the shape is the point: the money at risk from a venue failing should be the money you were already prepared to have working. Note that the risk here is a corporate one, denominated in fiat currency claims and legal jurisdictions, which is why it behaves nothing like market risk and cannot be hedged with a chart.
Operational risk: the losses you cause yourself
Operational risk is the wrong side, the wrong decimal place, the stop you never placed, the leverage left at 25x from yesterday, the API key you pasted into the wrong box. It is the least discussed and, for retail traders in their first year, plausibly the most expensive.
It is also the only category that responds well to a checklist, because every instance of it is a step somebody skipped.
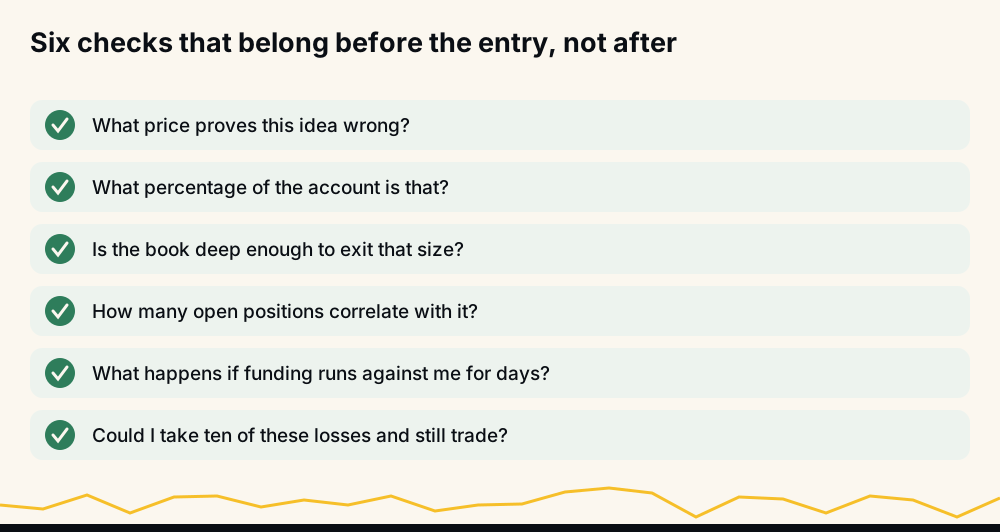
Fees and funding belong here too — not because paying them is a mistake, but because ignoring them in your arithmetic is. A strategy with a small edge can be entirely consumed by costs, and blockchain transaction fees are only the on-chain half of the bill.
How to measure financial risk before you take it
"Risk" is only useful once it is a number. Three measurements do most of the work, and none of them need software.
- Distance to invalidation. The percentage move from your entry to the price that proves the idea wrong. This is the only honest input to sizing.
- Risk per trade. What that distance costs as a share of the whole account if it is hit.
- Correlation count. How many open positions would lose together. Five long altcoin positions is one bet wearing five hats.
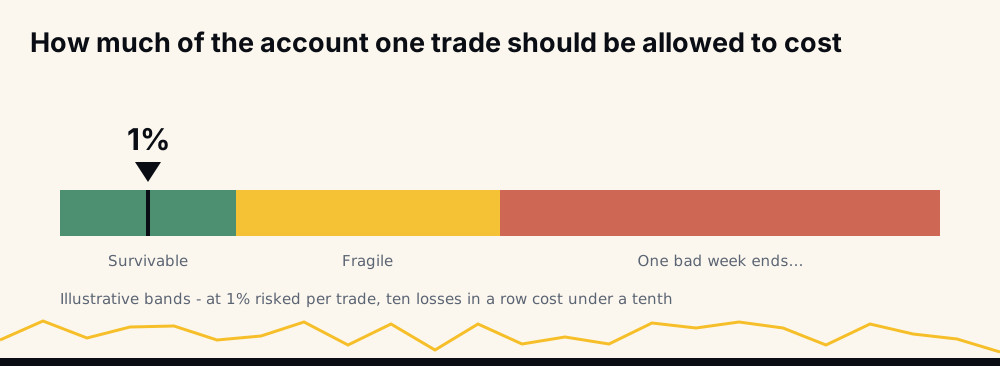
Risk per trade is where the survivable and the fatal separate. At 1% of the account per trade, ten consecutive losses cost under a tenth of the account and you are still trading. At 10% per trade, the same losing streak is over — and streaks of ten are ordinary, not exotic, for any system that wins six times out of ten.
How to size a position against the risk you measured
Sizing runs backwards from the loss you accept, never forwards from how convinced you feel. The order is fixed.
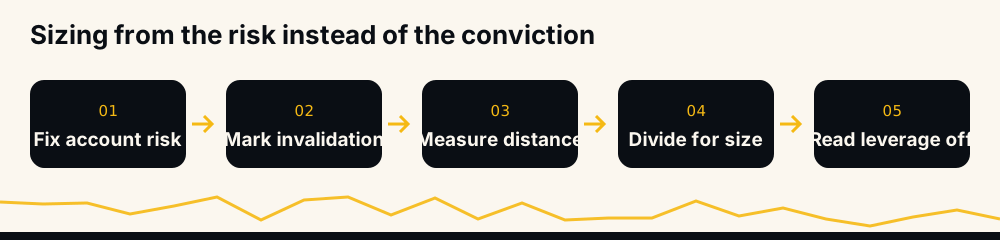
- Fix the account risk. Say 1% of equity.
- Mark the invalidation. The level that ends the idea — say 4% away from entry.
- Divide. 1% ÷ 4% means the position may be 25% of equity in notional terms.
- Read the leverage off the answer. It is an output, not a decision. If the arithmetic hands you 25% of equity and you post a quarter of that as margin, you are at 1x on the account, whatever the exchange dropdown says.
The result is that a tight invalidation permits a larger position and a wide one demands a smaller position, which is the opposite of how most accounts are actually traded.
What a stop-loss protects you from, and what it does not
A stop is a good tool with an oversold reputation. It converts an open-ended loss into a sized one and removes the 3am decision from a person who should not be making decisions at 3am. That is genuinely most of the job.
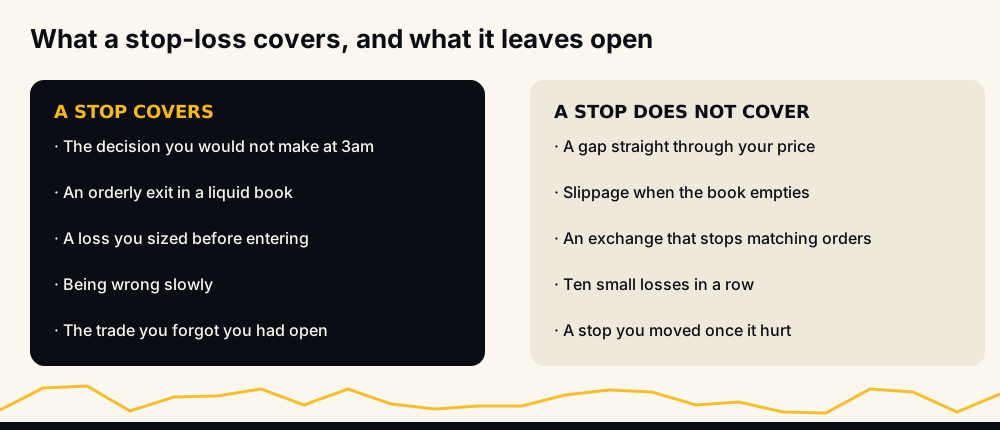
What it does not do: survive a gap, guarantee a fill price, protect you from an exchange that stops matching orders, or stop you from taking the same loss ten times. And a stop you move once it starts hurting is not a stop; it is a fee you pay for the feeling of having had one.
How a drawdown compounds, and why that is the real argument for limits
The asymmetry of losses is the single strongest argument for keeping risk per trade uncomfortably boring. A 20% drawdown needs 25% back to break even. A 50% drawdown needs 100%. An 80% drawdown needs 400%.
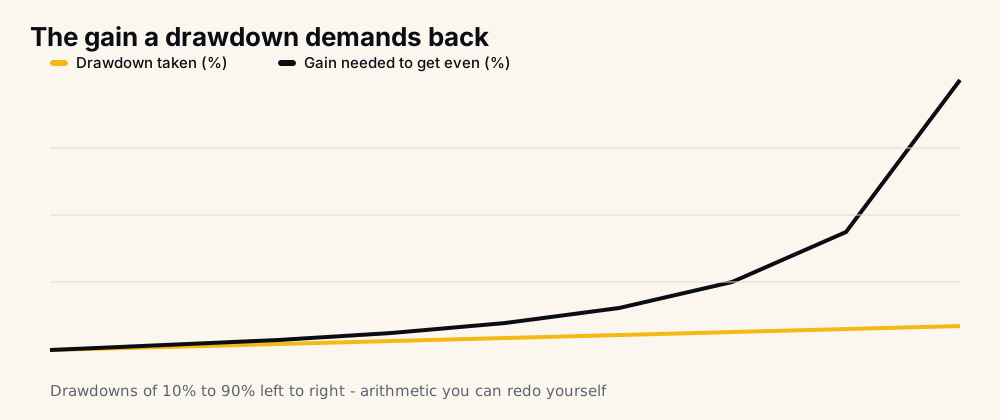
Nothing in that chart is a forecast — it is division you can redo on paper. But it explains why a trader who avoids the deep hole beats a better trader who does not, and why "I'll make it back" gets harder exactly as fast as it gets more urgent.
Financial risk versus business risk, and why traders confuse them
Business risk is the risk in the underlying activity: demand disappears, a product fails, a competitor undercuts you. Financial risk is the risk added by how the activity is funded — debt, leverage, currency mismatch, counterparty exposure.
Trading has both. The business risk is whether your strategy has an edge at all. The financial risk is everything the funding structure adds on top: the leverage, the venue, the liquidity of the instrument. A profitable strategy with an unmanaged funding structure still ends at zero, which is why the two questions have to be asked separately.
Mapping your risks by frequency and severity
Not all of these deserve equal attention. Sorting them by how often they occur against how badly they hurt is what a corporate risk register does, and it works just as well for one account.
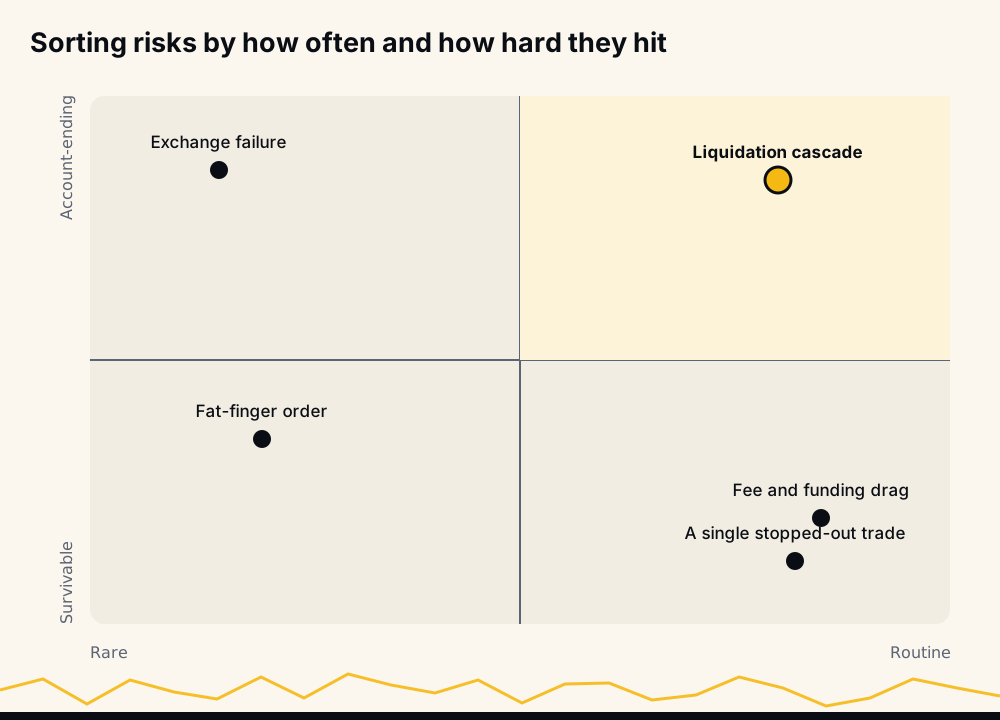
Fee drag is routine and survivable, so you optimise it. Exchange failure is rare but ends everything, so you cap exposure to it rather than trying to predict it. Liquidation cascades are the dangerous corner: frequent enough to expect, severe enough to remove you. That corner is where position sizing earns its keep.
What automation changes about risk, and what it does not
Automation removes a large slice of operational and behavioural risk. A rule executes at the same size at 4am as at noon, does not widen a stop out of hope, and does not skip the trade after three losses. If you are new to the category, what a crypto bot is covers the ground.
HafizeBot produces AI-generated signals from a model that evaluates 240+ indicators, formulas and components across 500+ Binance USDT-M perpetual pairs, rating each by strength. Autotrading runs on API keys that cannot withdraw, so funds stay on your own Binance account — a deliberate reduction of counterparty risk — and you set the limits yourself: minimum signal strength, position size, maximum simultaneous positions and coin filters.
What automation does not remove is market, leverage, liquidity or counterparty risk. Those are properties of the instrument and the venue, not of who presses the button. A bot sized badly liquidates exactly as fast as a human sized badly.
Where to check the record before you trust anyone
Risk talk is cheap, so here is what we publish instead of a promise. Thirty-three monthly spreadsheet reports covering June 2021 to February 2024 contain 33,694 signals with a median monthly accuracy of 98.9% as reported in those spreadsheets, and they are downloadable at our published reports.
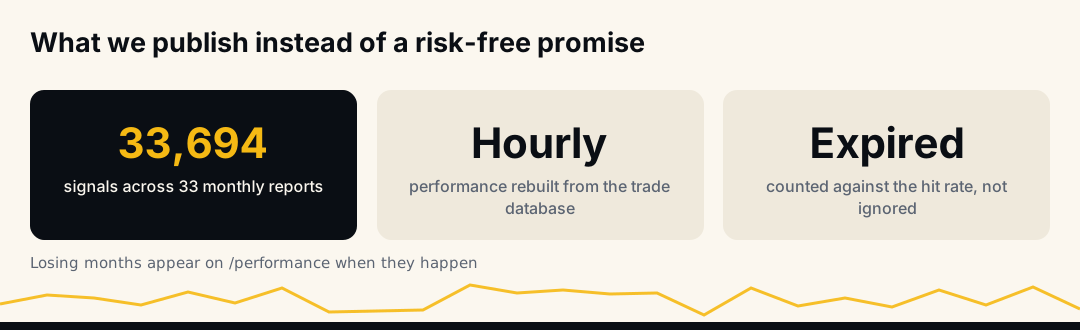
Since June 2026, the performance page has been regenerated hourly from the trade database: a win is a target hit, a loss is a stop hit, and an expired trade — maximum hold reached with neither — counts against the hit rate rather than being quietly dropped. PnL is shown unleveraged. Losing months appear there when they happen. You can also watch the same signals arrive with a 20-minute delay on the free channel at t.me/getbinancefutures, which has around 3,980 members as of August 2026, before paying for anything.
None of this is investment advice. Leveraged crypto trading can cost you the entire deposit, so trade only what you can afford to lose — that sentence is the whole of risk management compressed, and every technique above is just an attempt to make it true in practice.
Frequently asked questions
What are the main types of financial risk? Market, credit, liquidity and operational risk are the classical four. A leveraged crypto trader effectively works with market, leverage, liquidity, counterparty and operational risk, because you are depositing with a venue rather than lending, and because leverage attaches a deadline to being wrong.
How do you calculate financial risk on a trade? Take the distance from your entry to the price that invalidates the idea, express it as a percentage, and multiply by your position size relative to equity. That product is what the trade costs the account if the level is hit. Sizing is that equation solved for size instead.
Is leverage itself a financial risk? Leverage is an amplifier, not a separate danger — but the amplification is asymmetric. It scales gains and losses equally while adding liquidation, an outcome that has no upside twin. Roughly 100 divided by your leverage is the percentage move that exhausts an isolated position's margin.
Does a stop-loss remove financial risk? No. It caps market risk to a chosen amount under normal conditions. It does not survive gaps, guarantee your fill price, protect against exchange failure, or prevent a sequence of small losses from becoming a large one.
What is financial risk tolerance? It is the size of loss you can absorb without changing your behaviour — financially and emotionally. The practical test is not what you say in calm markets but whether you would still follow the same plan after four consecutive losses. If not, the size is wrong, not the plan.
How much of an account should one trade risk? There is no universal number, but the arithmetic is unforgiving: at 1% per trade a ten-loss streak costs under a tenth of the account, while at 10% per trade the same streak ends it. Losing streaks of that length are ordinary for any system, so the sizing has to assume one.