Between June 2021 and February 2024 we published a spreadsheet every month containing every signal we had sent: 33 files, 33,694 orders: 33,081 reached their target inside their month and 613 were still open when the month's sheet was cut, none of them stopped out. Monthly hit rates in those files run from 92.4% to 100.0%, with a median of 98.9% as reported in those spreadsheets. The files are still downloadable, and this article is about what they do and do not prove.
Almost every signal provider advertises a win rate. Almost none publish the rows behind it. The difference matters more than the number itself, because a rate is a claim while a file is evidence — and evidence can be recounted by somebody who does not like you. What follows is the whole record, the accounting rules that produced it, the months we would rather not show you, and the reasons your own result would not have matched it.
What is actually inside the thirty-three files
Each monthly file is a spreadsheet of the orders sent that month, one row per order, with the symbol, the direction, the entry, the outcome and the return. They are not summaries. The month's rate is what you get when you count the rows yourself.
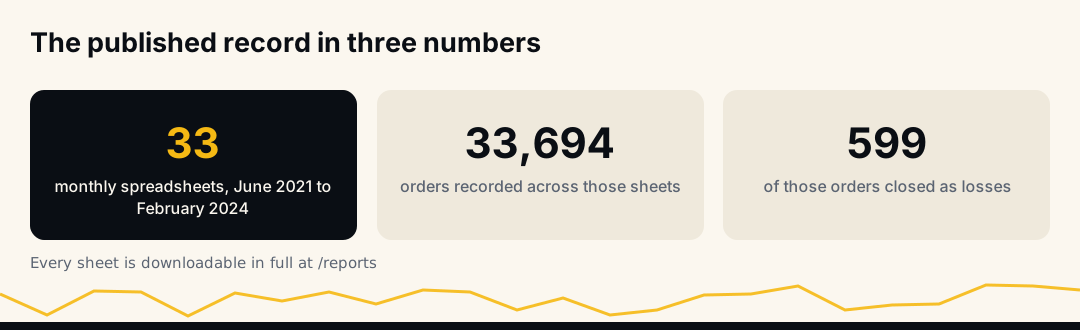
The sheets are archived, unedited, at our published reports page. A row that was written in 2021 says the same thing today as it did then, which is the only property that makes a track record worth anything at all.
Volume varies enormously by month, and that variance is itself informative. June 2021 has 409 orders. June 2023 has 2,522. January 2024 has 2,578. A provider posting three calls a week and a provider posting eighty a day are not doing the same job, and a single percentage flattens that distinction away.
The shape of the record, month by month
An average hides the thing a sceptic wants most: the dispersion. So here is every month plotted rather than summarised.
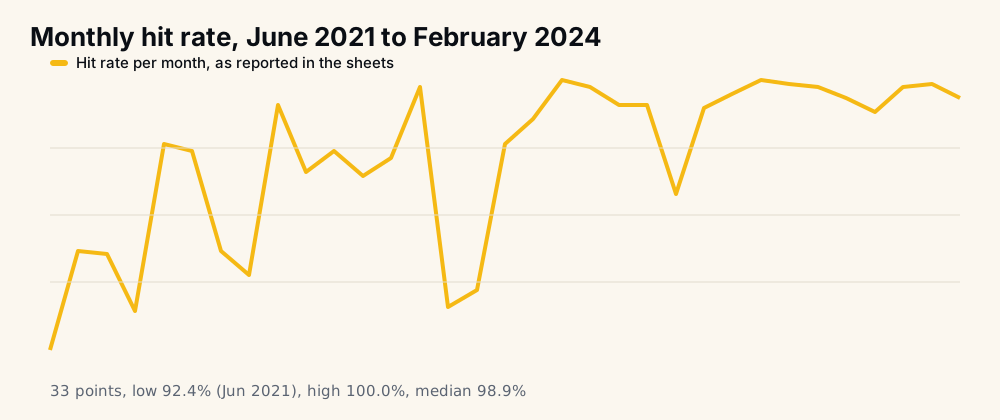
Two features are worth naming. The first is that the weak months cluster at the beginning — all seven months under 95% fall before October 2022. The second is that the line is not flat, which is the only reason to believe it was not written by a marketing department.
The median month reads 98.9% as reported in those spreadsheets. Aggregated instead across all 33,694 rows, the record is 98.2%, because the weaker months tend to be the busier ones and carry more weight. Both numbers are true; they answer slightly different questions, and quoting only the friendlier one would be the first small dishonesty.
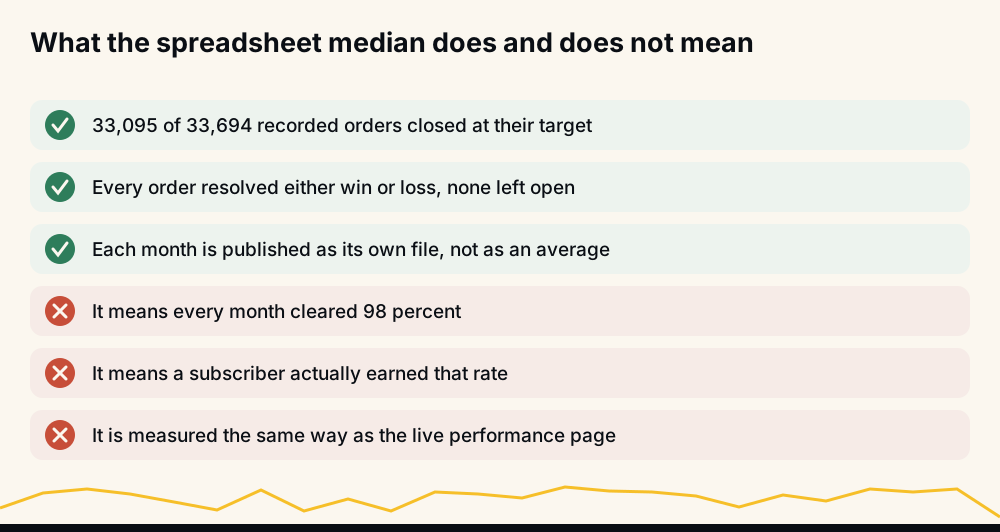
The three crossed lines on that card are the claims a headline rate is usually stretched to cover. None of them survive contact with the files.
Why these spreadsheets have no "expired" column
This is the caveat that matters most, so it gets its own section rather than a footnote.
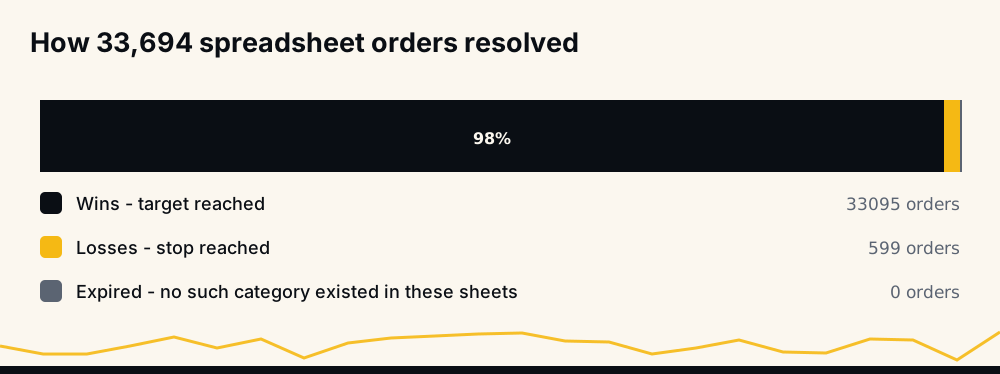
The spreadsheets had no maximum hold. A signal stayed open until it reached its target, and each month's sheet was cut at month end. So every row is either closed, target reached (33,081), or open, still running at the cut (613). None of the open rows was stopped out; the signals carried no stop. At the cut, 14 of those open rows sat above entry and 599 below it. The reports page counts all 613 against their month, whatever their mark; they were positions still waiting for their target, not closed losses.
That rule is a large part of why the headline rate is so high: a signal that took two months to recover never counted against the month it was sent in. The next section tells what became of those open signals, because a rate you cannot interpret is worth nothing.
What happened to the 613 open signals later
We checked each one against Binance's public price history up to September 2024 (591 of the 613 have it).
- Signal by signal, against its own target (estimated as that month's median target, and above the signal's best point before the cut), 445 of 591 reached it later, about three in four, a median 67 days after entry, after falling a median 56% first. 146 never did.
- Rebuilt as members traded them then, adding repeat signals on the same coin to the position with one merged take-profit (the bot's default at the time), 586 of 591 positions closed at their combined target, half within six days, at a median +2.2% unleveraged. The old signal's own part usually closed below its entry (median −7.4%); the later, cheaper entries made the profit.
- The cost was the wait: those positions fell a median 16% at their worst. At 5x leverage, where a 20% move costs the whole margin, roughly four in ten would have been liquidated first.
So the open rows were not losses, and most ended in profit for a member who averaged in and sat through the drawdown. They are also why a stop-loss and modest leverage matter, and why the live page puts a maximum hold on every signal and counts each expiry against the rate. The downloadable dataset has every row if you want to repeat the check.
The five weakest months, named
Naming your worst months is cheap to do and almost nobody does it, which is precisely why it is worth doing.
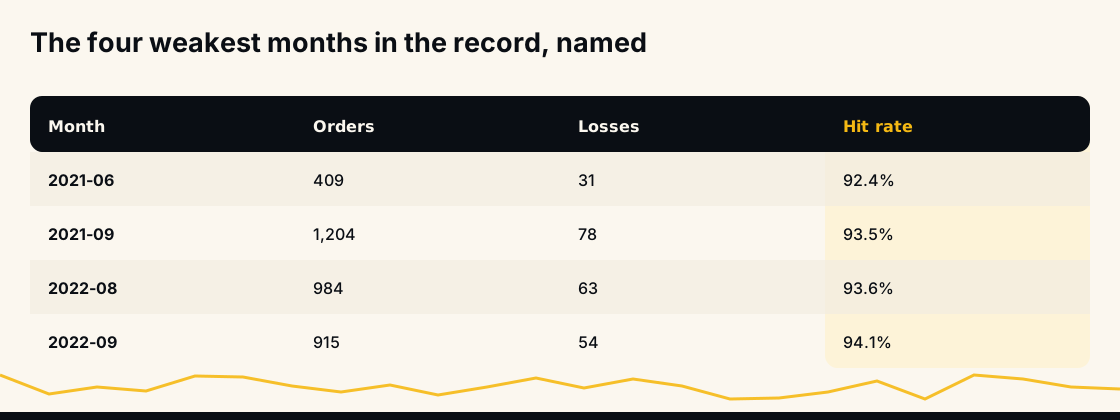
June 2021 is the floor: 409 orders, 31 of them still open and below entry when the sheet was cut, 92.4%. September 2021 is the loudest, because the volume was high — 1,204 orders and 80 still open at the cut, 93.4%. July 2021 follows at 93.9%. August and September 2022 sit at 93.6% and 94.1%, in the middle of a market that punished long exposure and in which the sheet was overwhelmingly long.
Individual rows go much further into the red than the monthly average suggests. The worst single order in May 2022 is recorded at -141.4%; February 2024 contains one at -179.84%. Those are leveraged per-order figures, not account outcomes, but they are in the file, and they are the reason a hit rate on its own tells you nothing about whether the month was survivable.
What the live performance page counts differently
The spreadsheet series stops at February 2024. Since June 2026 there has been a second, stricter record: the performance page, regenerated hourly straight from the trade database.
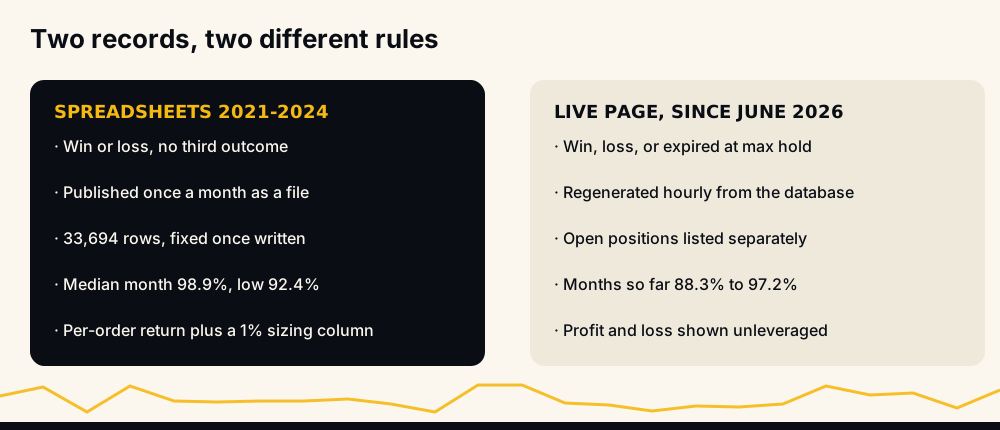
Its definitions are printed on the page. A win is a target hit, and the page shows Wins, Missed and Open. Broadcast signals carry a target and a maximum hold, not a stop, so every signal that does not reach its target in time counts as Missed and lowers the rate. The target-hit rate is wins divided by wins plus missed. Open positions are listed separately, not quietly counted as anything. Profit and loss is unleveraged.
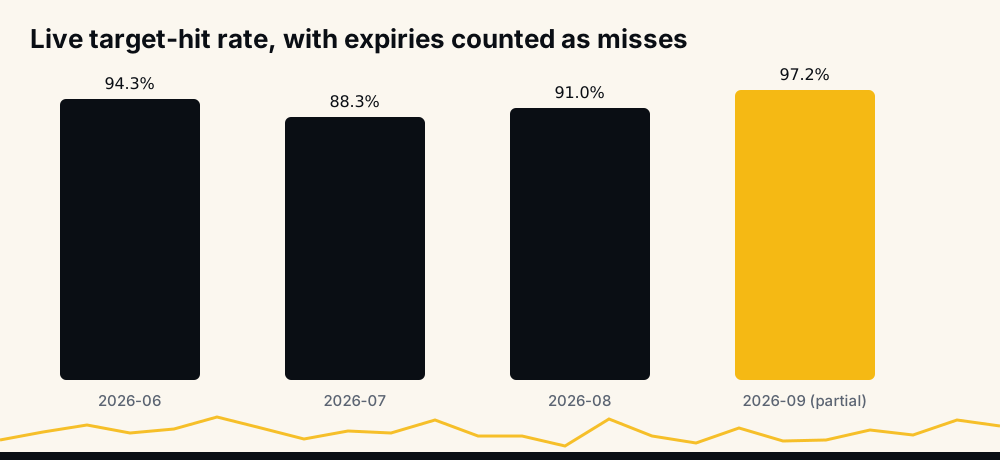
Under that rule the settled months read 98.4% for June 2026, 97.2% for July and 97.3% for August; September is still settling. Every month now follows one, longer hold; before October 2026 they read 94.3%, 88.3% and 91.0%. Only signals actually broadcast to members are counted; informational reports and internal experiments are excluded.
One missing column needs saying out loud. There is no Losses column, not because stops rarely trigger: broadcast signals carry no stop price. Every miss lands in Missed, and where to cut a loser is left to you.
The same month scored under both rules
Here is the comparison stated as plainly as we know how to state it.
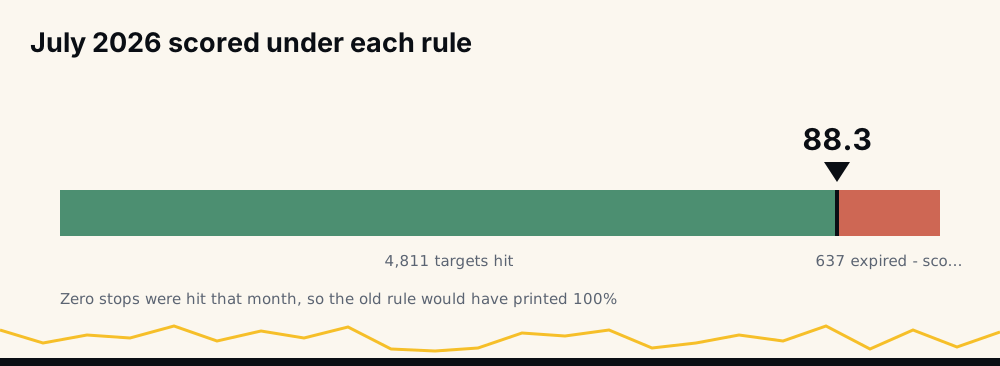
July 2026 broadcast 5,448 signals. 5,298 reached their target. 150 were missed. Under the live page's rule that is 97.2%. Under the spreadsheets' rule there would have been no missed category at all: those 150 would simply have stayed open until they reached target or the sheet was cut, and only the ones still open on the last day of the month would have counted against it.
That gap is not a rounding difference or a bad quarter. It is the same trades scored two ways, and it is the single most important thing on this page. Under that shorter hold July read 88.3%: the historical 98.9% as reported in those sheets and that 88.3% describe different measurements, not different performance. Anyone lining our historical figure up against a competitor's advertised one is comparing accounting systems, and probably losing the comparison without knowing it.
What counts as an order, and what the return columns mean
An order is one signal broadcast to the channel, on one symbol, in one direction, with its entry and its levels stated at the time of sending. Re-entries on the same symbol are separate rows. Nothing is merged, and nothing is added after the fact.
Two return columns appear per month, and they are not interchangeable:
- Average return is the mean per-order result for the month — 2.19% in June 2021, 0.31% in August 2022, 2.57% in June 2023 — a per-trade figure, not an account return.
- Return at 1% sizing is what the month's rows would have produced at a fixed 1% per position: 8.97% for June 2021, 3.08% for August 2022, 64.8% for June 2023. It is modelled from the rows, not anyone's realised balance, and it swings with volume: 2,522 orders compound far more than 400. That is arithmetic, not skill.
Why your own result would not have matched the sheet
The record is of signals, not accounts. Between the two sit at least six things:
- Entry timing. A row's entry is the price at the moment of sending. Yours is the price at the moment you acted.
- The free-channel delay. The free channel gets signals of strength 3 and up 20 minutes later, a long time in futures.
- Fills and slippage. Thin books and fast moves mean the price you see and the price you get are two different numbers.
- Fees and funding. Neither is in the per-order return column, and on high-volume months they are not small.
- Sizing and leverage. The 1%-sizing column is a model; different sizing or higher leverage changes the result at once.
- Selection. Nobody takes every signal in a 2,500-order month. The subset you took is your track record, not ours.
None of that makes the file less true: the record tells you about the signals, while risk management decides what happens to your money.
How a sceptic can audit the whole thing
You do not need our cooperation to check this, which is the point of publishing it.
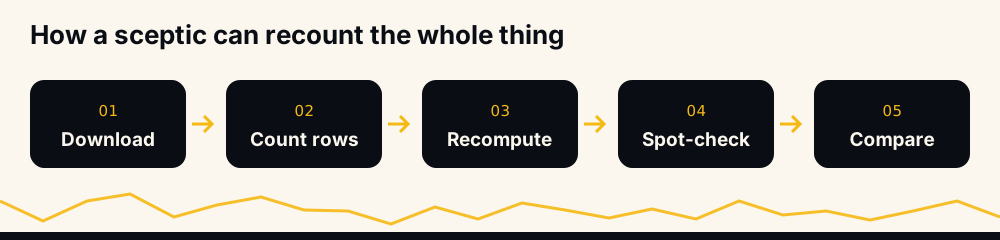
- Download. Take the monthly files from /reports. They are static; nothing is generated on request.
- Count rows. Recompute the month's rate from the rows rather than trusting our page: rows with a close time, over all rows.
- Recompute your way. The reports page treats every row still open at the cut as a miss: 98.18% (33,081 of 33,694). Count the 14 open rows that sat above entry as wins instead and you get 98.22% (33,095). Then look at the open rows' dates and prices yourself: that is where the waiting shows.
- Spot-check. Pick ten rows at random and check the symbol, direction and timestamp against exchange price history for that date.
- Compare. Set the result beside the live performance page, and watch the free channel for a fortnight: it should match the page's strength 3 and up rows.
Step four is the one that separates a real record from a manufactured one, and it takes about an hour. If you are evaluating anyone else in this category, the legitimacy checks for Telegram trading bots is the version of this process aimed at a provider who has published nothing.
What we do not publish, and why
We publish outcomes. We do not publish the recipe. There is no indicator list, no weighting scheme, no trigger logic anywhere in the sheets or on this site, and there will not be — a signal model that is fully described is a signal model that has been given away.
That is a genuine limitation for the reader and we will not pretend otherwise: you cannot inspect the process, only the results. Our answer is to make the results as inspectable as possible instead — a fixed file per month, a live page rebuilt hourly on stricter rules, and a free channel where the stronger signals appear publicly before anyone pays. Whether AI trading bots actually work is the broader version of that argument.
What changed after February 2024
The monthly spreadsheet series ends there. It was a manual process, and it stopped being the best available evidence once the trade database could be queried directly. The gap between February 2024 and June 2026 is not covered by either record, and we would rather say so than backfill it.
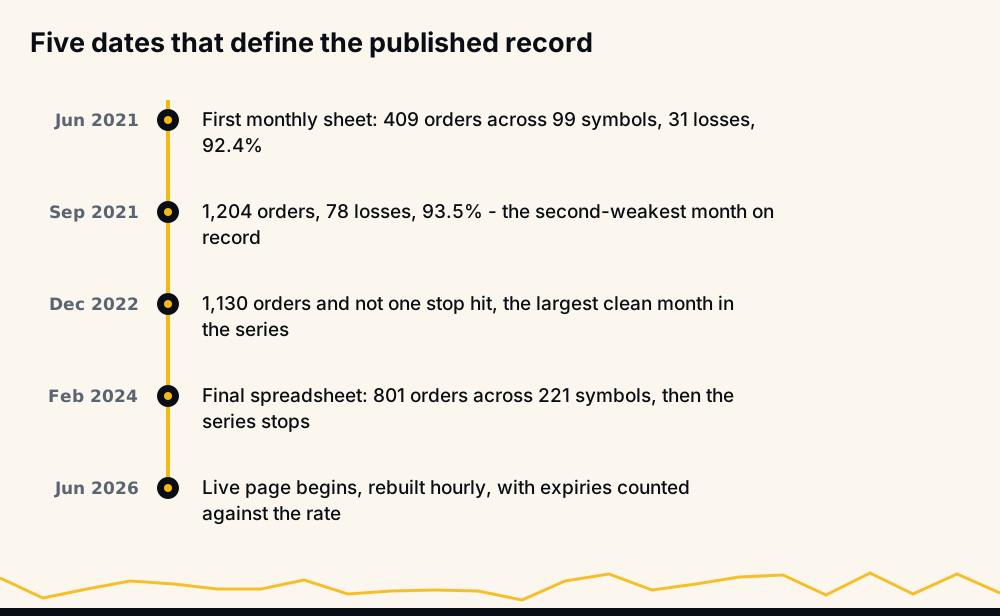
What replaced it is stricter in every respect that matters: hourly regeneration instead of monthly publication, three outcome categories instead of two, a maximum hold on every signal with each expiry counted against the rate, and open positions shown as open. Losing months will appear on that page when they happen, because nothing filters them out.
None of this is investment advice, and no track record is a forecast. Leveraged crypto trading can take the entire deposit, so trade only what you can afford to lose — and treat a published record, ours included, as a reason to look harder rather than a reason to stop looking.
Frequently asked questions
How many crypto signals has HafizeBot published? The monthly spreadsheets covering June 2021 to February 2024 contain 33,694 orders across 33 files, of which 33,081 reached their target inside their month; 613 were still open when the month's sheet was cut, none of them stopped out, and most reached their target later. Since June 2026 the live performance page has counted several thousand broadcast signals per month, rebuilt hourly from the trade database.
Why is the historical hit rate higher than the live one? Because they are computed differently. The spreadsheets had no maximum hold: a signal stayed open until it reached target, and any still open when its month's sheet was cut counted against the month. The live page gives every signal a maximum hold and counts each one that expires, with neither target nor stop, against the rate. A signal that takes three weeks to recover is a win under the first rule and a miss under the second.
What was the worst month in the record? June 2021, at 92.4%: 409 orders, 31 of them still open below entry at the cut. The next weakest are September 2021 at 93.4% on 1,204 orders, August 2022 at 93.6%, July 2021 at 93.9% and September 2022 at 94.1%. All five are published in full alongside the better months.
Can I verify the track record myself? Yes, and without asking us. The monthly files are downloadable, so you can count the rows, recompute the rate under whichever definition you prefer, and check individual entries against exchange price history for the date on the row. The live page can be compared against the free channel in real time.
Why don't you publish the strategy behind the signals? Because a fully described model can be copied, and the value of the signals would go with it. The published ceiling is that the signals are AI-generated from a system evaluating 240+ indicators, formulas and components across 500+ Binance USDT-M perpetual pairs. Everything we can prove without giving it away is in the record instead.