Circulating supply is the number of tokens that can actually be traded right now. Total supply is everything that has been created and not destroyed, including tokens locked in vesting contracts and treasuries. Max supply is the hard ceiling written into the protocol, if one exists at all. Market cap uses the first number; fully diluted valuation uses the third — and the gap between those two valuations is where most token investors get hurt.
That gap is the whole subject. A token can look modestly valued and be enormously valued at the same time, depending on which supply figure you multiply by the price.
The three supply numbers, defined precisely
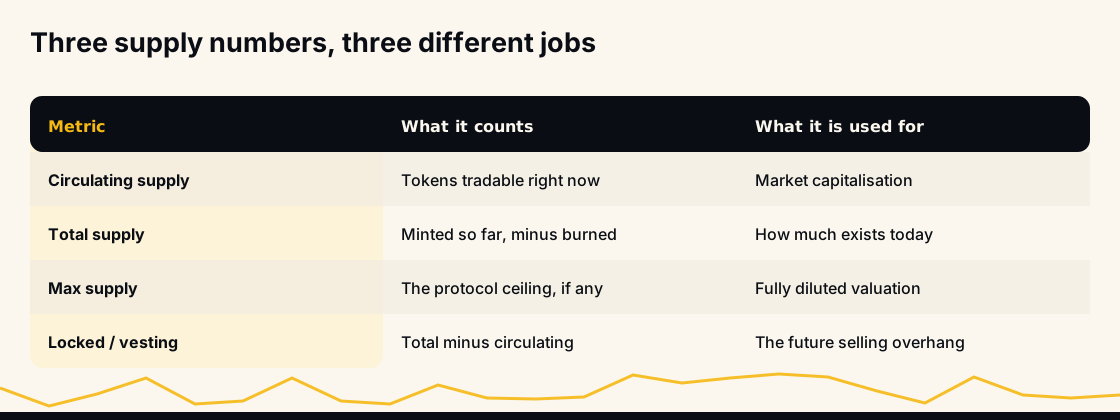
Circulating supply excludes tokens that exist but cannot be sold: team allocations still in a cliff, investor tranches vesting monthly, foundation treasuries, and — depending on whose methodology you read — tokens burned or provably lost.
Total supply is minted minus burned. It includes every locked token, so it is always at least as large as circulating supply and often several times larger in a young project.
Max supply is a ceiling, and plenty of assets have none. Bitcoin's 21 million is enforced by consensus rules. Ethereum has no cap at all; its supply expands with issuance and contracts with the fee burn described in how blockchain transaction fees work. Dogecoin has no cap either, adding a fixed quantity of new coins forever.
How market cap is calculated from circulating supply
The formula is one multiplication:
Market cap = circulating supply × price
That is all. There is no adjustment for how the tokens got there, how thinly they trade, or whether anyone could actually sell at that price. It is a headline, not a valuation.
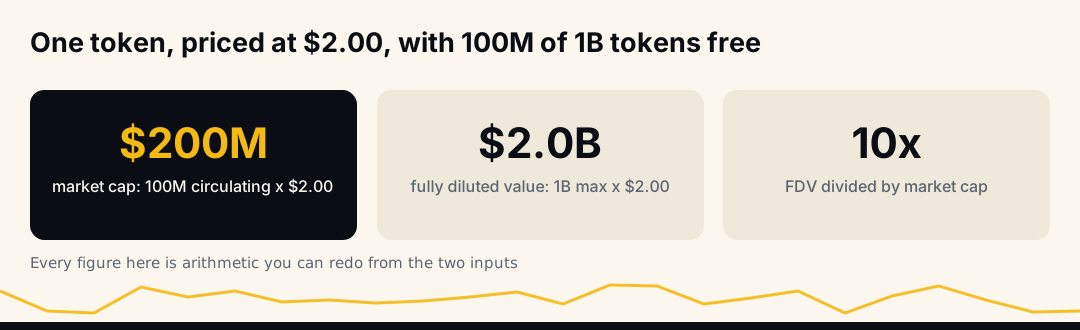
A token trading at $2.00 with 100 million tokens circulating has a market cap of $200 million. Notice what that number does not tell you: whether 100 million is the whole supply or a tenth of it.
Fully diluted valuation, and the ratio that matters
FDV = max supply × price
Same price, different multiplier. If that $2.00 token has a max supply of one billion, its fully diluted valuation is $2.0 billion — ten times its market cap.
The FDV-to-market-cap ratio is the single most useful number you can derive here, and it takes one division. A ratio near 1 means nearly everything is already issued and dilution is behind the asset. A ratio of 10 means nine out of every ten tokens have yet to reach the market.
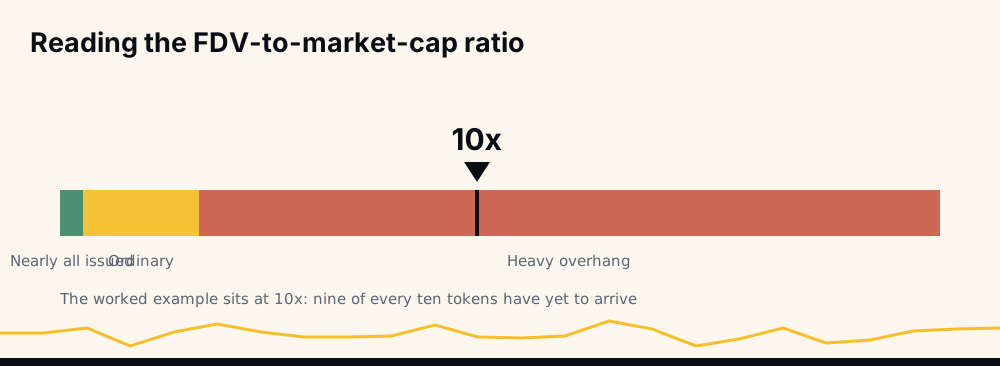
A high ratio is not automatically a verdict. It is a statement about what has to happen: for the market cap to hold as supply arrives, someone must buy every unlocked token at the prevailing price, or the price falls.
The arithmetic that makes unlocks painful
Take that same token and assume the market's total willingness to hold it stays fixed at $200 million while supply expands to the full billion.
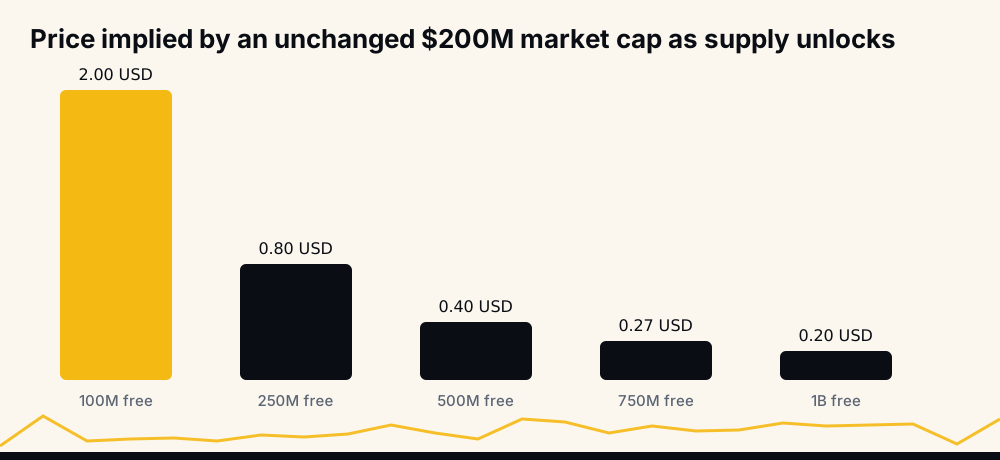
At 250 million circulating, $200 million ÷ 250 million = $0.80. At 500 million, $0.40. At the full billion, $0.20 — a 90% decline with no bad news, no hack, and no change in the project. Only more sellers holding the same asset.
That is the mechanism people describe as "the chart bleeding for no reason". There is a reason; it is on a calendar published before launch.
What an unlock schedule actually does
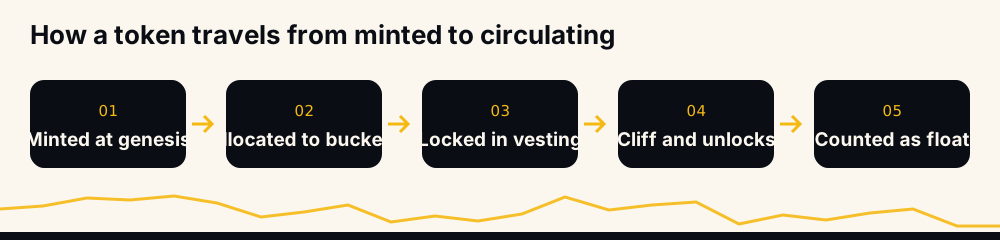
Tokens do not arrive smoothly. The standard structure is a cliff — a period during which nothing at all unlocks — followed by monthly linear releases.
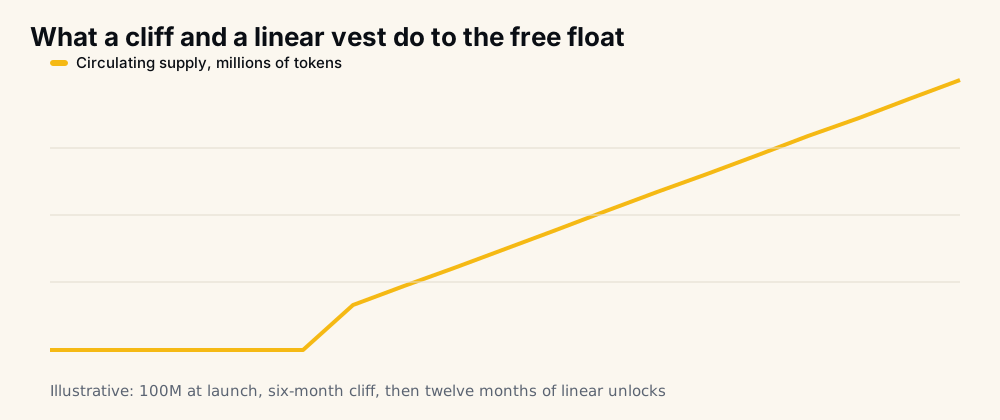
The cliff is the dangerous part. During it the float is artificially small, so relatively little buying moves the price a long way, and the chart in that window is not representative of anything that follows. On the cliff date a single tranche can arrive that is larger than the entire existing float.
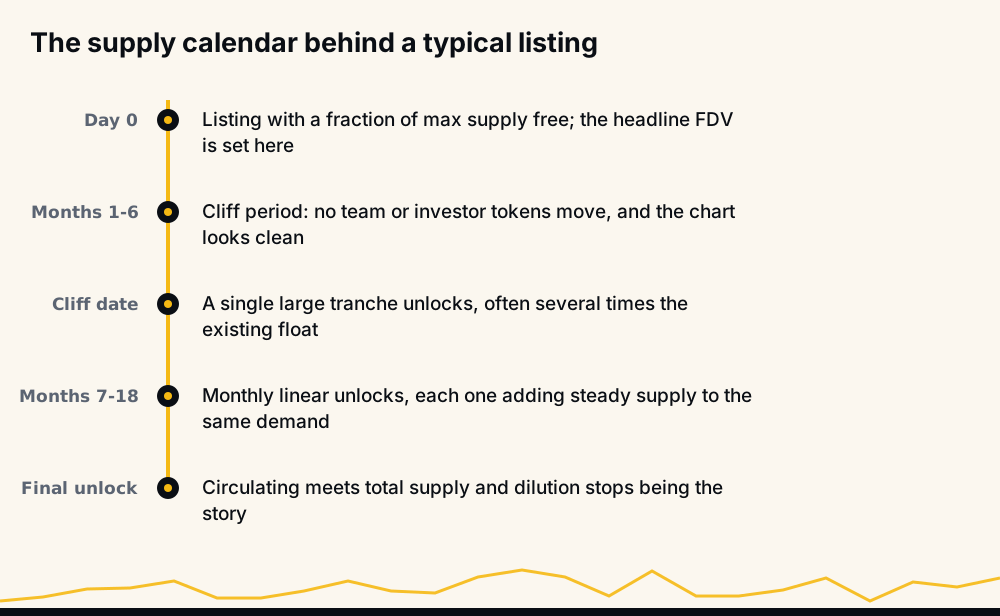
Two questions answer most of it: when is the next unlock, and how big is it relative to the current circulating supply? A tranche worth 5% of float is background noise. One worth 150% of float is the dominant fact about that asset for the month.
Where the locked tokens actually sit
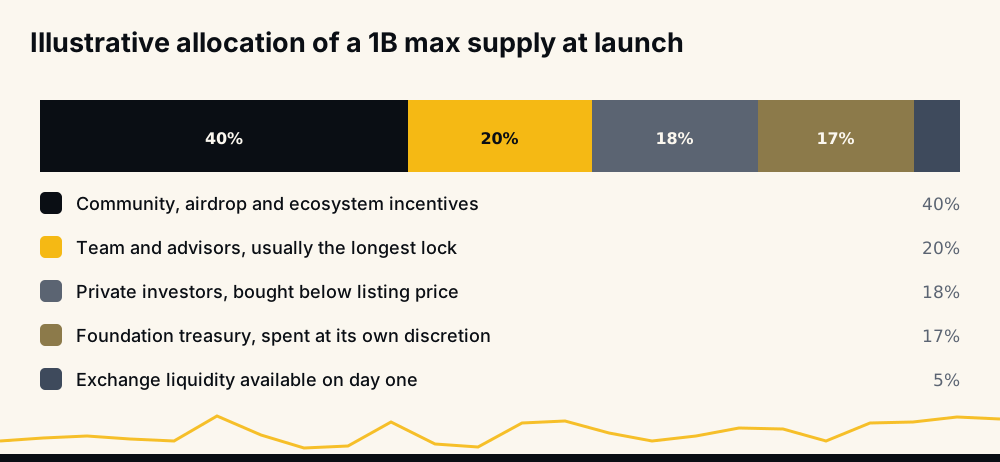
Those proportions are illustrative rather than measured — every project publishes its own — but the shape is typical, and two rows deserve attention. Private investors usually bought well below the listing price, so they are profitable at prices that would be losses for you. And a foundation treasury is spent at the foundation's discretion, which means supply can enter the market without any unlock event at all.
Why a low circulating supply is not automatically bullish
The most persistent myth in this subject is that scarcity of float means the price must rise. Search interest in "coins with low circulating supply" is steady, and the reasoning behind it does not survive contact with the arithmetic.
A small float means two things at once: it takes less money to move the price up, and it takes less money to move it down. Thin markets are volatile in both directions, and they are the easiest places to run the tactics described in market manipulation in cryptocurrency.
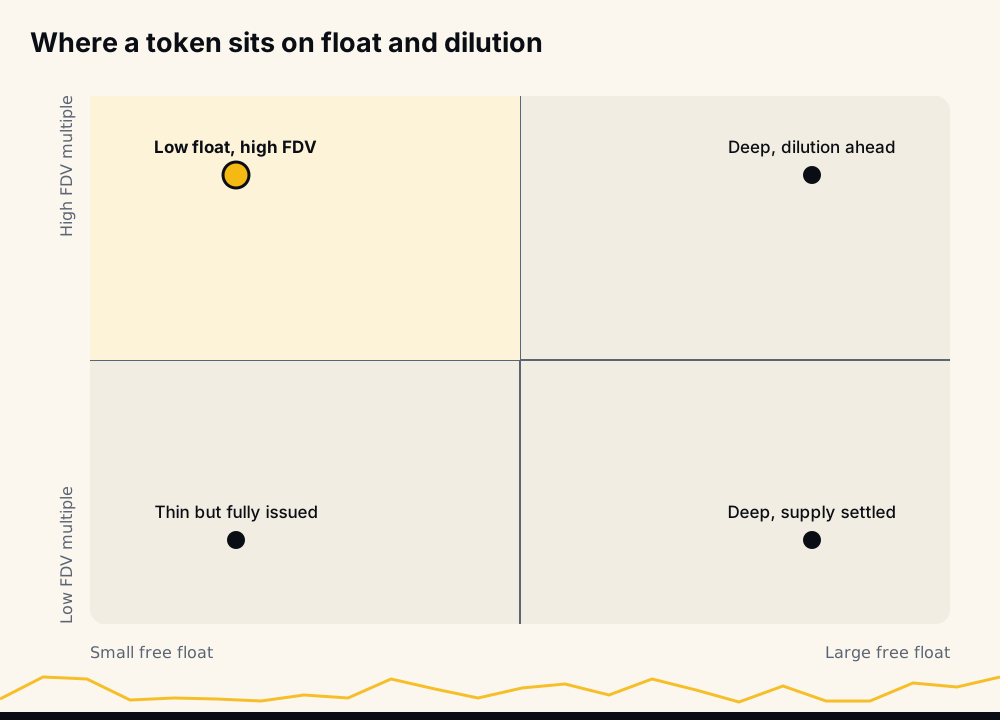
The corner to understand is low float with a high FDV multiple: a small tradable supply supporting a large headline valuation, with most of the supply still to come. It is a structure that flatters early charts and punishes late buyers, and it has been the dominant listing pattern for several years.
Why the unit price of a coin tells you nothing
"It's only $0.0001, imagine if it hits $1" is a supply error, not an opinion.
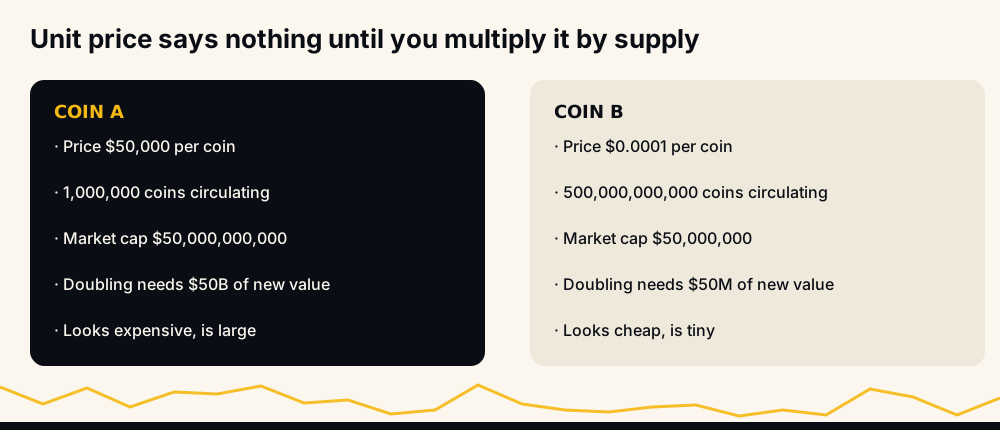
Coin B is a hundred times smaller than Coin A despite the vastly lower unit price. Doubling Coin B needs $50 million of net inflow; doubling Coin A needs $50 billion.
Run the same logic on a meme token with a circulating supply in the hundreds of trillions. At $1 per token, its market cap would run to hundreds of trillions of dollars — comfortably more than every stock market on earth combined. The target is not ambitious; it is arithmetically unavailable.
Can circulating supply go down?
Sometimes, and less often than people think.
- Burns permanently destroy tokens. Whether the price benefits depends entirely on whether those tokens were circulating in the first place — burning an unissued treasury allocation changes the headline number, not the float.
- Fee burns remove a slice of every transaction, as Ethereum's base fee does. During heavy usage this can exceed issuance and shrink the supply outright.
- Re-locking into staking or escrow reduces the tradable float without destroying anything. It is reversible by definition.
- Lost keys shrink the true float but not the reported one, since nobody can prove a coin is unreachable.
Most of the time, though, circulating supply only moves in one direction. XRP is the case that generates the most searches: its remaining escrowed tokens release on a schedule, which raises circulating supply over time rather than lowering it.
Four supply designs you can compare today
The major assets illustrate four genuinely different answers to the same question.
Bitcoin has a hard cap of 21 million, more than 94% of which already exists. New issuance halves roughly every four years, so its circulating supply rises on a decelerating curve towards a ceiling it reaches around the next century. Total supply and circulating supply are effectively the same number.
Ethereum has no cap. Supply grows with validator issuance and shrinks with the burned base fee, so in busy periods the total supply can fall outright. Its supply is a balance rather than a schedule.
XRP was created in full at the start — 100 billion tokens, none of them mined. A large block was placed into escrow and releases on a published schedule, which is precisely why its circulating supply is high and keeps climbing rather than falling. Searchers asking whether it will go down are asking about a mechanism that only runs one way.
Dogecoin has no maximum either, but its issuance is a fixed quantity per block forever. Because the absolute addition stays constant while the base grows, its percentage inflation falls every year even though the coin count never stops rising.
Capped tokens sit between these poles. Chainlink's one billion LINK, for instance, is a fixed ceiling with a substantial share released gradually rather than mined — which is why its circulating supply is a moving number in a way Bitcoin's ceiling is not.
How supply metrics get gamed
Supply figures look like facts and are frequently editorial. The common tricks:
- Self-reported circulating supply. Aggregators have historically relied on project-supplied figures. A team that counts its treasury as locked when it is being spent understates float and overstates scarcity.
- Theatrical burns. Destroying tokens that were never tradable, or sending them to an address the team still controls, produces a headline with no economic effect.
- Staked tokens counted as circulating. Tokens with a multi-week unbonding period are not available to sell today, yet routinely appear in the float.
- Bridged and wrapped double counting. The same underlying token represented on several chains can be counted more than once if the accounting is careless.
- A max supply that is only a parameter. Where a governance vote or an admin key can raise the ceiling, "max supply" is a current setting, not a guarantee. Check whether the cap is enforced by consensus or by a promise.
- Rebasing supply. In elastic-supply designs the token count changes for every holder, which makes naive supply comparisons meaningless.
None of this requires fraud. It requires only that the number reaches you through someone with an interest in how it looks.
How to check a token's supply yourself
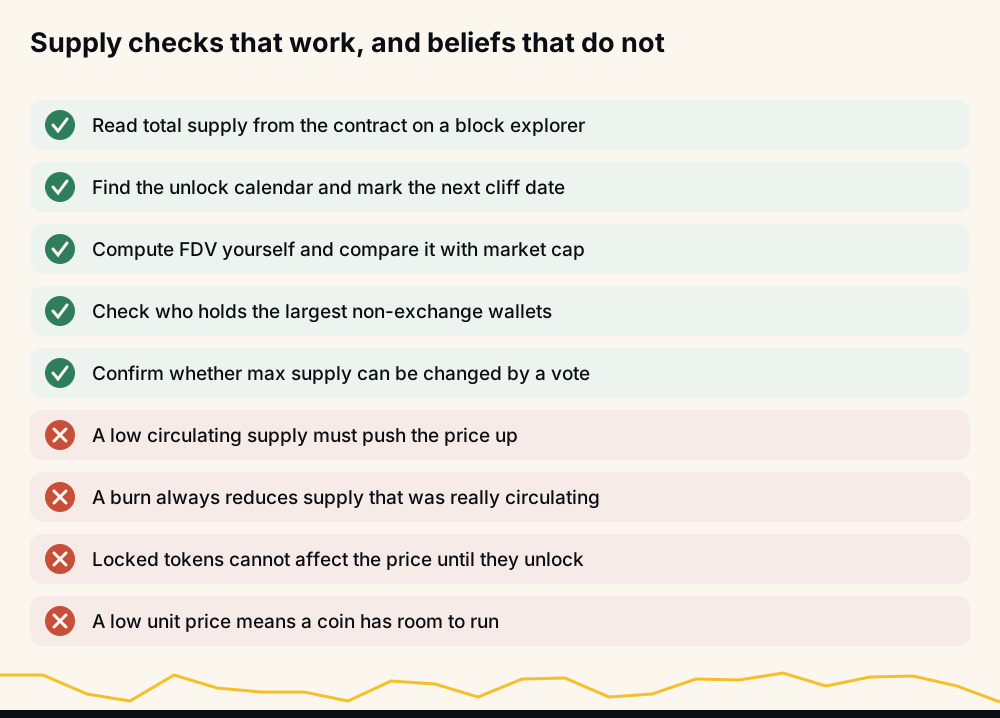
The verifiable path takes about ten minutes:
- Read total supply from the contract. Any block explorer shows a token contract's supply directly on-chain. That is the one number nobody can present differently.
- Look at the largest holders. Explorers list top addresses. Identify the ones that are treasuries, vesting contracts or exchange wallets, because the difference between total and genuinely tradable supply lives there.
- Find the vesting schedule. It is normally in the project's documentation, and several trackers now aggregate unlock calendars. Mark the next cliff.
- Compute FDV yourself. Multiply max supply by price and divide by market cap. If the ratio is high, you know what the coming year has to absorb.
- Check whether the cap can move. Read the contract's minting permissions or the governance rules.
Supply is not a prediction, and none of these checks tell you where a price is going. What they do is stop you being surprised by an event that was on a public calendar the entire time.
Where supply sits in a trading decision
For anyone trading rather than holding, supply structure mostly shows up as risk to be sized for. A thin float and a looming unlock mean wider swings and worse fills, which is exactly the territory covered in what financial risk really means. It also explains why buying a young token on the spot market and buying an established perpetual are not remotely the same activity, even when the charts look alike.
HafizeBot's signals cover 500+ Binance USDT-M perpetual pairs — a set dominated by assets whose supply is largely issued and whose order books are deep enough that no single participant sets the price. The record is published rather than described: /reports holds 33 monthly spreadsheets covering June 2021 to February 2024 and 33,694 signals, at a median monthly accuracy of 98.9% as reported in those sheets, and since June 2026 the /performance page has been regenerated hourly from the trade database, counting a hit stop as a loss and an expired position against the hit rate, with PnL shown unleveraged. Signals come from AI-generated analysis evaluating 240+ indicators, formulas and components.
The free channel t.me/getbinancefutures carries the same calls on a 20-minute delay to around 3,980 members, which is enough to check the arithmetic in this article against live markets without paying for anything. Autotrading, where used, runs on API keys that cannot withdraw, with funds staying on the user's own Binance account. None of this is investment advice, and no amount of supply analysis makes a position safe. Trade only what you can afford to lose.
FAQ
What does circulating supply mean in crypto? It is the number of tokens available to trade right now, excluding those locked in vesting contracts, team allocations and treasuries. It is the figure multiplied by price to produce market capitalisation, which is why it appears on every listing page.
What is the difference between circulating supply and total supply? Total supply counts everything created and not destroyed, locked tokens included. Circulating supply counts only the portion that can actually be sold today. The difference between them is the supply still waiting to reach the market.
How do I calculate circulating supply and market cap? Market cap is circulating supply multiplied by price, and circulating supply is total supply minus locked, vesting and reserved tokens. To check it yourself, read total supply from the token contract on a block explorer and subtract the balances held in treasury and vesting addresses.
Does a low circulating supply mean the price will go up? No. A small float makes the price easier to move in both directions and easier to manipulate. If most of the supply is still locked, a low float usually signals dilution ahead rather than scarcity.
Why does fully diluted valuation matter? Because it prices the asset as if every token already existed. When FDV is many times the market cap, holding the price steady requires buyers to absorb every unlocked token as it arrives, and that demand has to come from somewhere.
Can circulating supply decrease? Occasionally — through genuine burns, fee burns that outpace issuance, or tokens being re-locked into staking. More often it only rises, especially where escrowed or vesting allocations release on a published schedule.