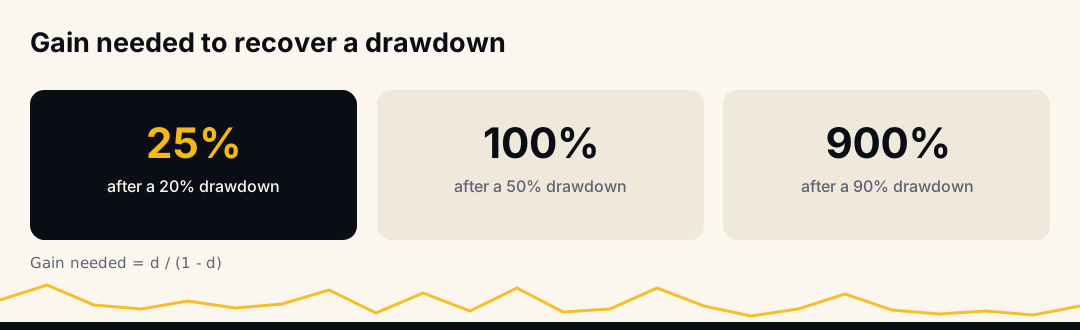
Max drawdown in trading is the largest fall in account equity from a peak to a later low, as a percentage of that peak. It matters because losses and gains are not symmetric: recovering a drawdown of d needs a gain of d ÷ (1 − d). A 20% drawdown needs 25% to get back, a 50% drawdown needs 100%, and a 90% drawdown needs 900%.
That one formula explains most of what experienced traders say about risk. Below: how to calculate max drawdown from your own history, the recovery table, how long recovery takes, how ordinary losing streaks and leverage build drawdowns, and what limits it. Every number is arithmetic you can redo, and every example is an illustration with made-up figures.
What is max drawdown in trading?
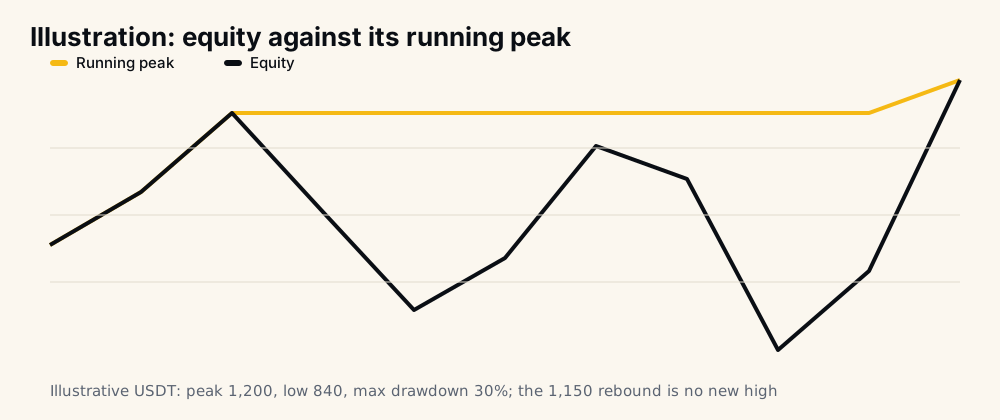
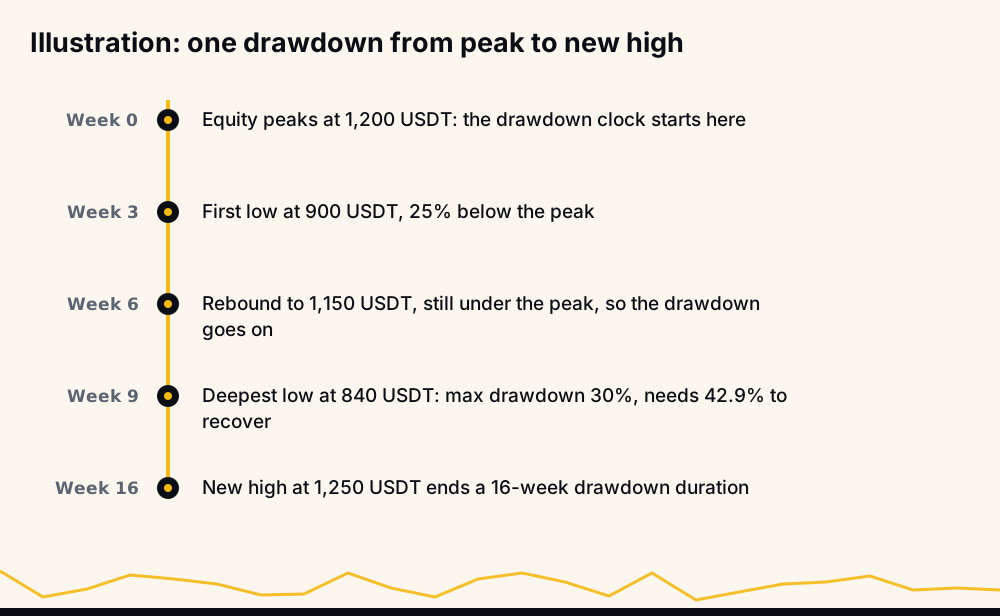
A drawdown is any fall from a previous equity high. The max drawdown is the deepest one over the period you measure. It is quoted as a percentage of the peak it fell from, so a fall from 1,200 to 840 USDT is a 30% drawdown, whatever the account did before.
Three details decide what the number means:
- Equity, not balance. Equity includes open profit and loss. An account whose closed trades look fine can carry a deep drawdown in open positions.
- Peak to later trough. The low has to come after the high. A dip before the account ever made a new high counts against the starting point.
- The period. Max drawdown only grows as history gets longer. A three-month figure says less than a three-year one, because the worst stretch may not have arrived yet.
How to calculate max drawdown
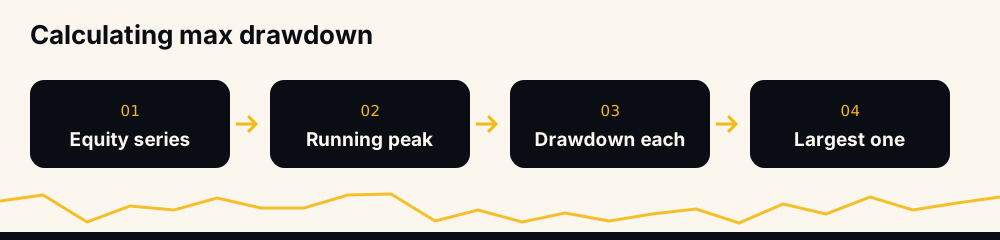
You need your equity at regular points, daily or after every trade. Then:
- Track the running peak: at each point, the highest equity so far.
- Compute the drawdown at each point: (running peak − equity) ÷ running peak.
- Take the largest value. That is the max drawdown.
A worked example with illustrative numbers. An account goes 1,000, 1,080, 1,200, 1,050, 900, 980, 1,150, 1,100, 840, 960, 1,250 USDT. The running peak reaches 1,200 on the third point and stays there until the last one. The first dip, to 900, is a 25% drawdown. The rebound to 1,150 never makes a new high, so the later fall to 840 is measured from 1,200 as well: (1,200 − 840) ÷ 1,200 = 30%. That is the max drawdown, even though the biggest single drop between neighbouring points was smaller.
In a spreadsheet this is three columns: equity, a running maximum (=MAX(B$2:B2) copied down), and the drawdown. The largest number in the last column is your answer. Python's pandas does the same with cummax().
The drawdown recovery table
The reason drawdowns deserve their own word: a loss is measured from the old, larger balance, and the recovery from the new, smaller one. From 1,000 to 800 is −20%; from 800 back to 1,000 is +25%.
Gain needed to recover = d ÷ (1 − d)
| Drawdown | Gain needed to get back |
|---|---|
| 10% | 11.1% |
| 20% | 25.0% |
| 30% | 42.9% |
| 40% | 66.7% |
| 50% | 100% |
| 60% | 150% |
| 75% | 300% |
| 90% | 900% |
Shallow drawdowns cost little extra. Past about 40% the curve turns steep, and past 50% recovery needs the account to more than double. That is why so much risk advice aims at keeping drawdowns shallow rather than chasing a higher return.
Max drawdown recovery period: how long does it take?
The gain needed is only half of the story. Time depends on what the account earns per trade or per month once it starts recovering. With an average net gain g per trade, compounded:
Trades to recover = ln(1 ÷ (1 − d)) ÷ ln(1 + g)
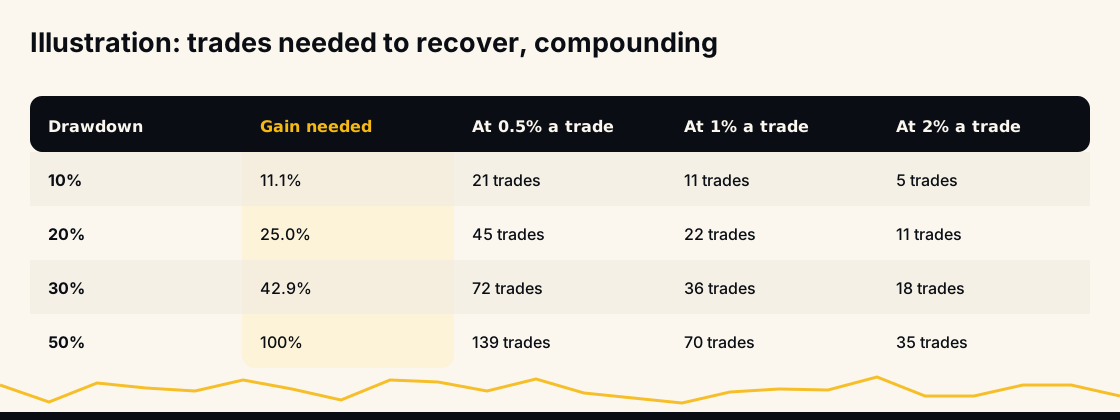
At an illustrative 0.5% average per trade, a 10% drawdown takes about 21 trades to recover, 20% about 45, 30% about 72 and 50% about 139. Doubling the average gain roughly halves those numbers. Two things follow. A deep drawdown can cost months even for a strategy that works, and any average gain you plug in is a guess about the future, since the drawdown itself may mean the edge has changed.
The time from the peak, through the trough, back to a new peak is the drawdown duration. Tracking it next to the depth tells you something the percentage hides: a 15% drawdown that lasts a year is harder to live with than a 25% one that recovers in a month.
How losing streaks build a drawdown
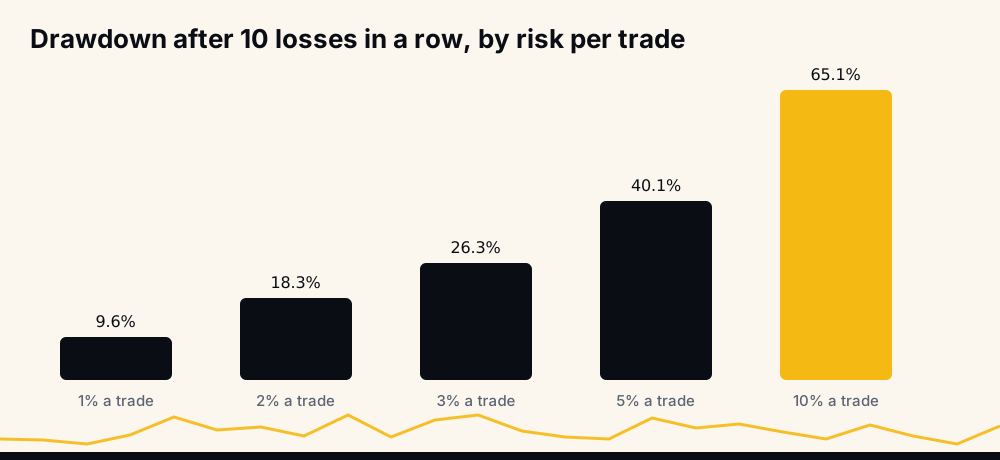
Most drawdowns are not one disaster. They are a run of ordinary losses. If each losing trade costs a fixed share r of the current account, n losses in a row leave (1 − r)ⁿ of it:
- At 1% per trade, 5 losses cost 4.9%, 10 cost 9.6%, 20 cost 18.2%.
- At 2% per trade, 5 losses cost 9.6%, 10 cost 18.3%, 20 cost 33.2%.
- At 5% per trade, 5 losses cost 22.6%, 10 cost 40.1%, 20 cost 64.2%.
How long a streak should you expect? A rough rule from probability is that the longest losing run in N trades, with a loss probability q per trade, is about ln(N) ÷ ln(1 ÷ q). With 40% losing trades, that is about 5 in a row over 100 trades and about 7 over 500. Even with only 10% losing trades it is about 3 in a row over 1,000. The approximation assumes independent trades, and crypto trades often are not, which makes real streaks longer.
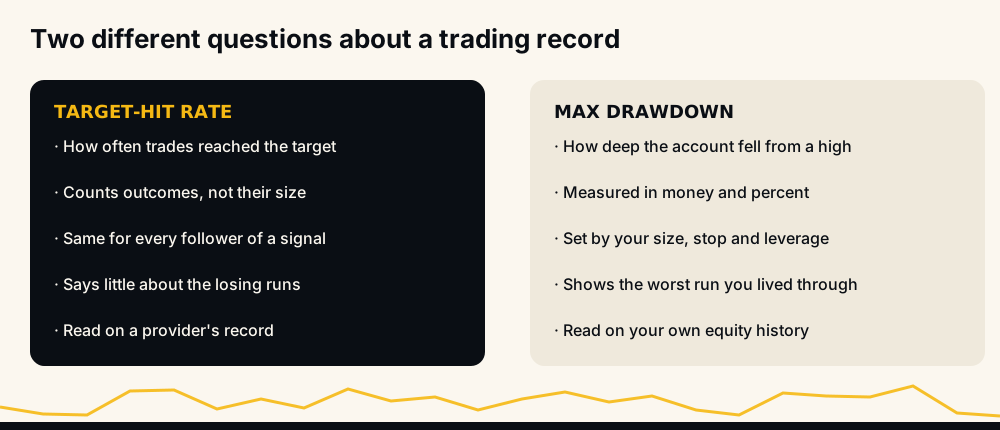
A high hit rate shrinks the streaks but does not remove them, and it says nothing about how big each loss is. What a realistic crypto signal win rate looks like covers why a hit rate and an account's drawdown measure different things.
Leverage and drawdown in crypto futures
Leverage does not change drawdown by itself. What changes it is the size of each loss, and leverage often changes that quietly.
- Sized from the stop. If you decide the loss at the stop first and size the position from it, a 1% risk per trade is a 1% hit at 2x or 20x. Leverage only changes the margin locked.
- Sized from margin. If you put a fixed margin on each trade, the loss at the stop is margin × leverage × stop distance. With 5% of the account as margin, a 5% stop costs 0.5% of the account at 2x, 1.25% at 5x and 2.5% at 10x. Each step up in leverage deepens every drawdown.
- Liquidation is a 100% drawdown of the position's margin. On isolated margin it stops there; on cross margin the loss draws on the whole futures balance, which is how one trade turns into an account-level drawdown. Isolated vs cross margin compares the two.
Crypto futures position sizing with leverage works through both sizing methods, and what leverage to use on crypto signals shows how far a stop can sit at each leverage before liquidation gets there first.
Correlated positions: the drawdown nobody planned
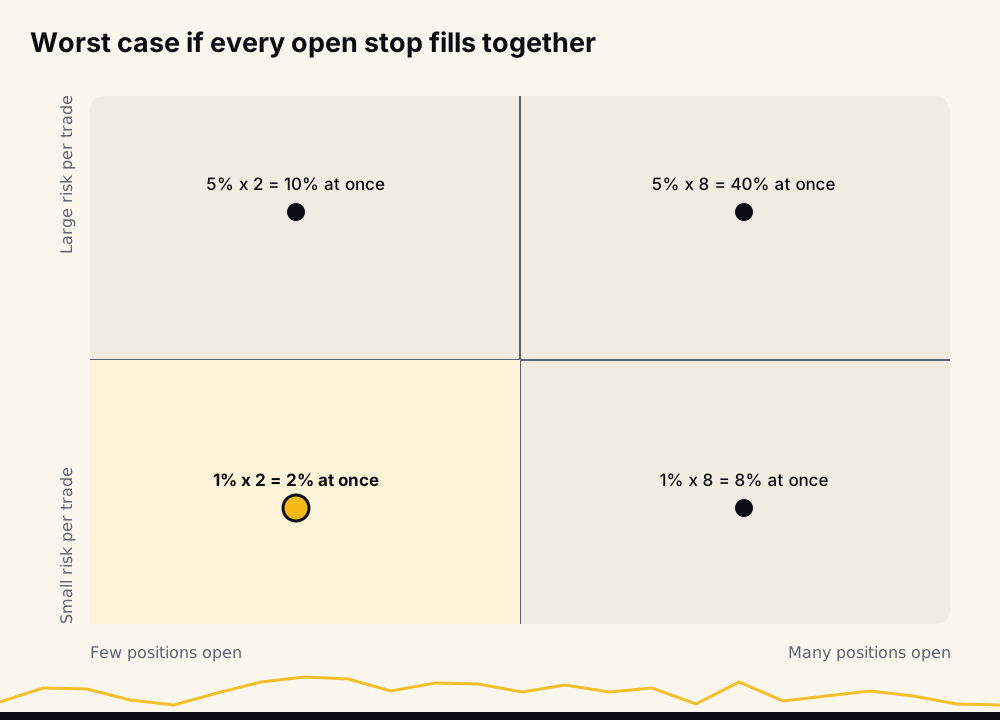
Signal traders and bots often hold several positions at once, and crypto coins tend to fall together. If five positions each risk 1% and the market drops hard, all five stops can fill in the same hour: a 5% drawdown from what felt like five separate 1% bets.
Two numbers describe that worst case, and both are under your control:
- Positions open at once × risk per position is the loss if every stop fills together.
- Stop distance against liquidation distance decides whether those stops fill at all. A stop past the liquidation price never fires; liquidated before your stop-loss lists the ways that happens.
What is a good max drawdown?
There is no universal good number, because drawdown only means something next to return. Two ratios put them together:
- Recovery factor = net profit ÷ max drawdown, both in money. A recovery factor of 3 means the account earned three times its worst fall.
- Calmar ratio = annual return ÷ max drawdown, both in percent, usually over three years.
A personal limit is more useful than a benchmark. Decide in advance the drawdown at which you stop and review, sized so the recovery from it is realistic: the table says 20% needs 25%, while 40% needs 66.7%. Then set the risk per trade and the number of open positions so that an ordinary streak stays well inside it. How much money you need to start crypto futures uses the same arithmetic to size an account.
Trailing max drawdown at prop firms
Funded-account programmes often use a trailing max drawdown: the loss limit follows your equity high instead of staying fixed at the starting balance. With a 1,000 USDT trailing limit on a 10,000 account, the floor starts at 9,000; if equity reaches 10,800, the floor moves up to 9,800. A later fall to 9,900 is only about 8.3% from the high, yet it sits 100 USDT from failing the account.
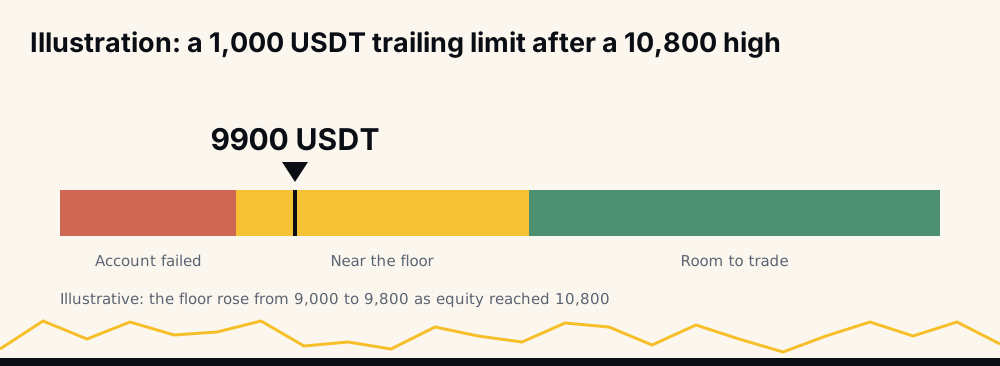
Firms differ in the details. Some trail the end-of-day balance, some the intraday equity high, and many stop trailing once the floor reaches the starting balance. Read your programme's rules, then size every trade against the distance to the floor, never against the account's headline balance.
How to reduce max drawdown
None of these raises returns. All of them make the worst stretch shallower.
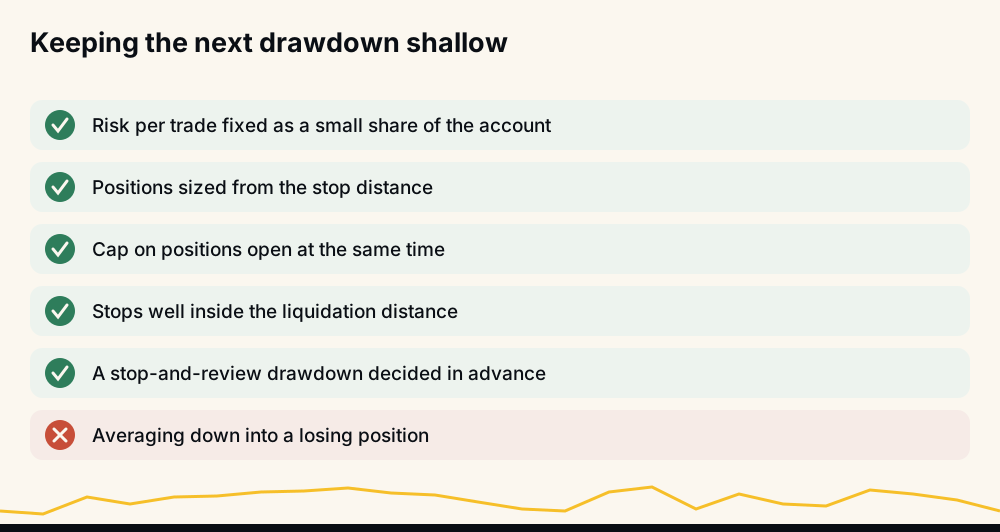
- Fix the risk per trade as a small share of the account, and size positions from the stop. How to set a stop-loss in crypto covers where to put it.
- Cap positions open at once. The worst case is positions × risk; the cap is the lever.
- Keep stops well inside the liquidation distance, and prefer isolated margin when several trades are open.
- Do not add to losing positions to average down. It turns a planned loss into a bigger, unplanned one.
- Set a stop-and-review drawdown before you start, and honour it.
Drawdown and HafizeBot's autotrader
HafizeBot's broadcast signals carry a target and a maximum hold, not a stop, and the live performance page scores each one at its target, counting every missed signal against the rate; September 2026 settled at 97.7% of 4,220 signals. That record says how often signals reached their targets. It is not your account's drawdown, which depends on the settings you choose on your own Binance account.
Those settings are the levers from the checklist above: /setPositionSize for the margin per trade, /setLeverage, /setPositionLimit for how many positions can be open at once, /setStopLoss for the price move from entry at which each position closes, /setMarginType for isolated or cross, and /setMinStrength to take only higher-rated signals. The default settings start at 5 USDT of margin at 2x, up to 3 positions, isolated margin and a 10% stop: about 1 USDT at the stop per trade and about 3 USDT if all three stop together, plus fees.
The signals are AI-generated, from a model that evaluates 240+ indicators, formulas and components. Past results guarantee nothing about the next drawdown, which is why the size and the stop stay in your hands.
Frequently asked questions
What is max drawdown in trading? It is the largest fall in account equity from a peak to a later low, as a percentage of that peak. It describes the worst losing stretch over the period measured, including open positions.
How do you calculate max drawdown? Record equity at regular points, track the highest value so far, and compute (peak − equity) ÷ peak at each point. The largest of those values is the max drawdown.
How much gain do I need to recover from a drawdown? Divide the drawdown by one minus the drawdown. A 20% drawdown needs 25%, a 30% drawdown needs 42.9%, and a 50% drawdown needs 100%.
What is a good max drawdown? There is no universal figure; judge it against return with the recovery factor or Calmar ratio. Many traders set a personal stop-and-review limit, kept shallow enough that the recovery it requires is realistic.
What is a trailing max drawdown? It is a loss limit that follows your equity high. When equity sets a new high, the floor rises by the same amount, so a fall from the new high can fail the account even if you are still above the starting balance.
How does leverage affect drawdown? Only through position size. If you size from your stop, leverage changes margin but not the loss. If you keep a fixed margin per trade, higher leverage makes each position and each loss bigger, and liquidation can take the whole margin.
The recovery maths in one line
A loss of d needs a gain of d ÷ (1 − d) to repair, so the cheapest drawdown is the one you never let get deep: fix the risk per trade, cap open positions, keep stops inside liquidation, and decide your limit before the losing streak arrives.
To watch signals before risking anything, the free channel posts the stronger ones (strength 3 and up) 20 minutes after VIP. The 7-day free trial in @hafizebot caps autotrading at 10 USDT of margin per entry and 3 open positions; plans are 50, 100 or 200 USDT a month through /join.
This is not investment advice; leveraged futures can lose your whole margin, so trade only what you can afford to lose.