In our public archive of 33,694 Binance USDT-M futures signals sent between June 2021 and February 2024, 98.2% reached their target, under the archive's own rule that a signal counts as closed only when its target is hit. That number is real and it is also the least useful fact in this study: the median target was a 1.48% move, more than one winning signal in ten first went 10% or more against its entry, and the 613 that never arrived were a median 18.95% under water when their month closed.
This is a data study, written to be checked. Every figure below was computed from the file anyone can download at our signal dataset page, and the method is at the end so you can recount it. We are the provider being measured, so read it with that in mind, and argue with the file rather than with us.
The dataset and the counting rule
The file has one row per signal the bot broadcast, flattened from the 33 monthly order spreadsheets published on the reports page. It covers 277 distinct pairs. The busiest month holds 2,578 signals, the quietest 326, and the median month 915.
Each row has a status. Closed means the sheet recorded the signal reaching its target. Open means it was still running when that month's sheet was cut, with its result shown as a mark-to-market snapshot at the cut. There is no stop-loss outcome and no expiry in this archive. That is a looser rule than any provider should be judged by on its own, and it is the reason the rest of this article exists.
One detail for anyone reconciling with the monthly sheets: in six months of 2021 and early 2022 the rate printed on the sheet is 0.1 to 1.3 points higher than a row count gives (July 2021 reads 95.2% on its sheet and 93.9% by rows). The difference is exactly 14 signals that were still open, but in profit, at the cut. This study counts only target hits, so it uses the lower figure.
The headline: 98.2% reached target
Of 33,694 signals, 33,081 closed at their target and 613 were still open at the cut. That is 98.2% across all rows. Taken month by month instead, the median month is 98.9% as reported in those sheets, under their own rule.
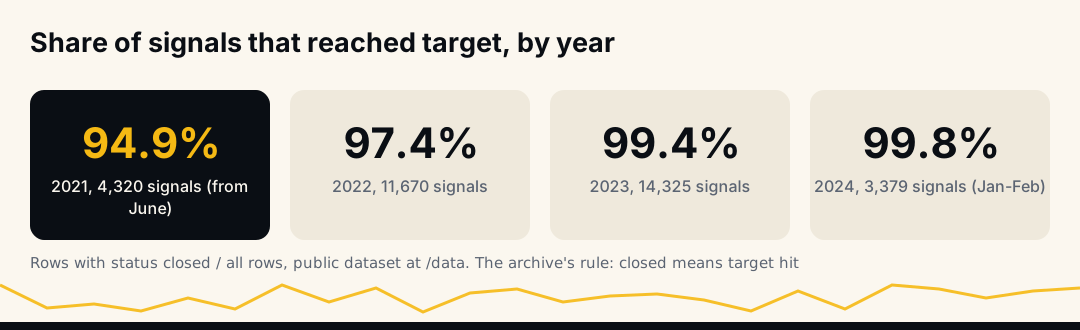
The rate climbs every year: 94.9% of 4,320 signals in 2021 (from June), 97.4% of 11,670 in 2022, 99.4% of 14,325 in 2023 and 99.8% of 3,379 in the first two months of 2024. Read that as a description of the archive, not a trend to extrapolate. The live record since June 2026, counted more strictly, reads lower, and we come to it below.
Month by month, with the weak months named
An average hides the months a sceptic most wants to see, so here is every one of the 33.
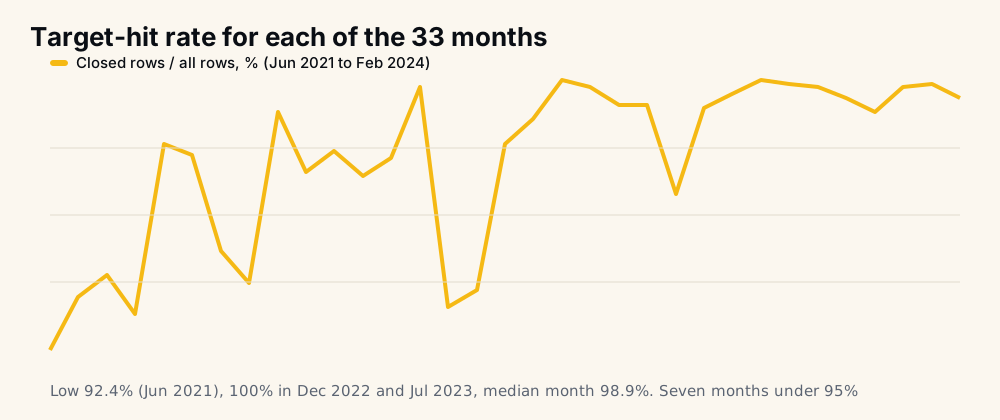
The worst month is the first: June 2021 at 92.4%. Seven months fall under 95%, and all of them sit in 2021 and 2022:
- June 2021: 92.4%
- September 2021: 93.4%
- August 2022: 93.6%
- July 2021: 93.9%
- September 2022: 94.1%
- January 2022: 94.3%
- August 2021: 94.5%
At the top, December 2022 and July 2023 both reached 100%, meaning no signal from those months was left open at the cut. A flat line near 100% would be the suspicious shape; this one dips hard in some months, which is what a real record does.
How long does a crypto signal take to hit its target?
Speed matters because every hour a position is open is an hour it can go wrong. For the 33,081 signals that reached target, measured from entry time to close time as the sheets recorded them:
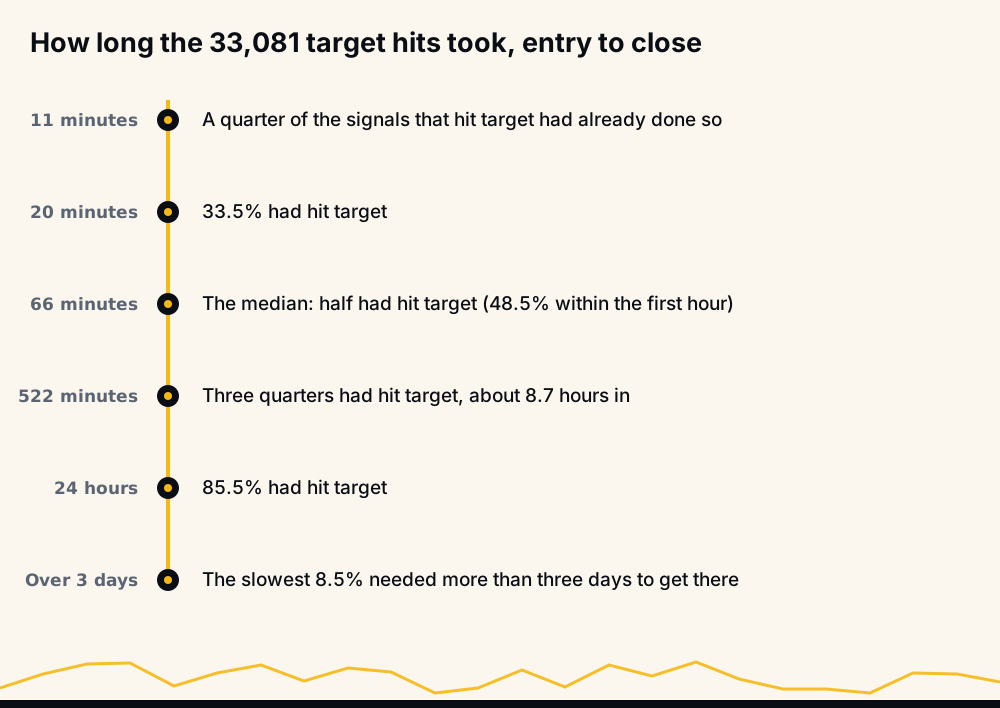
- A quarter got there within 11 minutes.
- 33.5% within 20 minutes, and 48.5% within the first hour.
- The median was 66 minutes.
- Three quarters within 522 minutes, about 8.7 hours.
- 85.5% within 24 hours.
- 8.5% took more than three days.
That last group is the one to think about. A signal that needs three days to reach a 1–2% target spent most of that time somewhere else, and a trader holding it with leverage had to survive the whole journey. The 20-minute figure also matters to anyone on a delayed feed: our free channel carries the same signals 20 minutes later, and by then a third of the eventual winners in this archive had already hit their target.
How big were the targets?
A hit rate means nothing until you know what a hit is worth. In this archive, the answer is: not much per signal, before leverage.
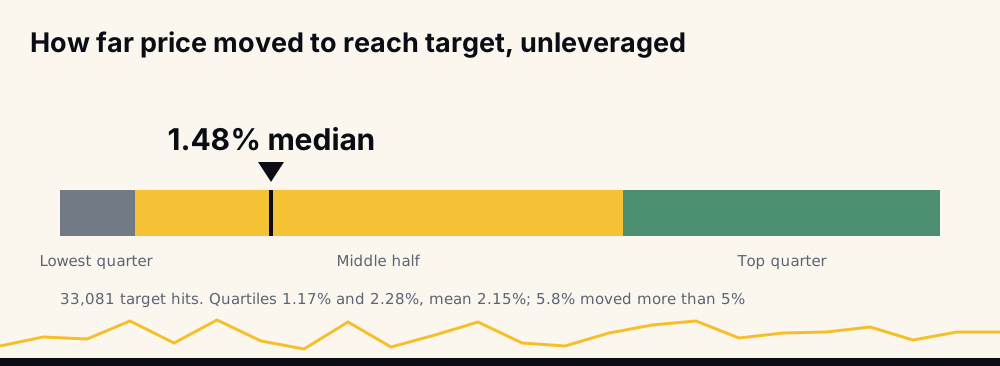
The median move from entry to target was 1.48%, unleveraged. The middle half sat between 1.17% and 2.28%, and the mean was 2.15%, pulled up by a minority of larger moves. Only 5.8% of target hits moved more than 5%.
Small targets are easier to hit. That is not a criticism, it is arithmetic: the closer the target, the more often price gets there first. It is why a high hit rate and a small target travel together, and why a provider quoting one without the other has told you half a fact. We work through the break-even arithmetic in what a realistic crypto signal win rate looks like.
What happened on the way to the target
Every row records the worst point the signal reached before it closed, as its sheet recorded it. This is the column most win-rate claims leave out, and it changes how the headline reads.
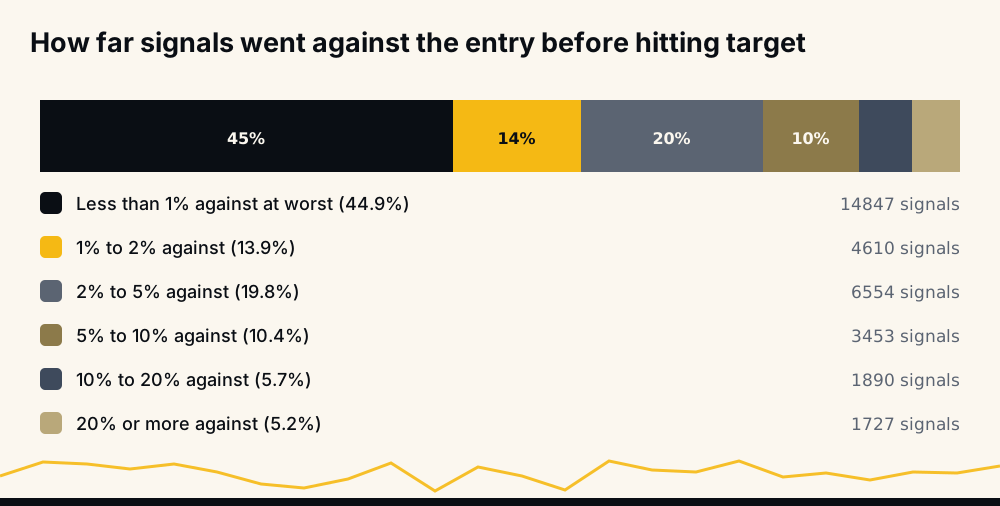
The median winner dipped 1.32% against its entry before turning. That is comparable to the median target itself, which tells you something: the typical winning signal went roughly as far the wrong way as it eventually went the right way.
The tail is where it matters:
- 21.4% of winners went 5% or more against first.
- 10.9% went 10% or more against first.
- 5.2% went 20% or more against first.
Every one of those is counted as a win in the 98.2%. None of them looked like one while it was happening.
What that dip means with leverage
Unleveraged, a 10% dip is uncomfortable. With leverage it is a different event. At 10x, a 10% move against you is the whole margin on that position. At 20x it takes a 5% move.
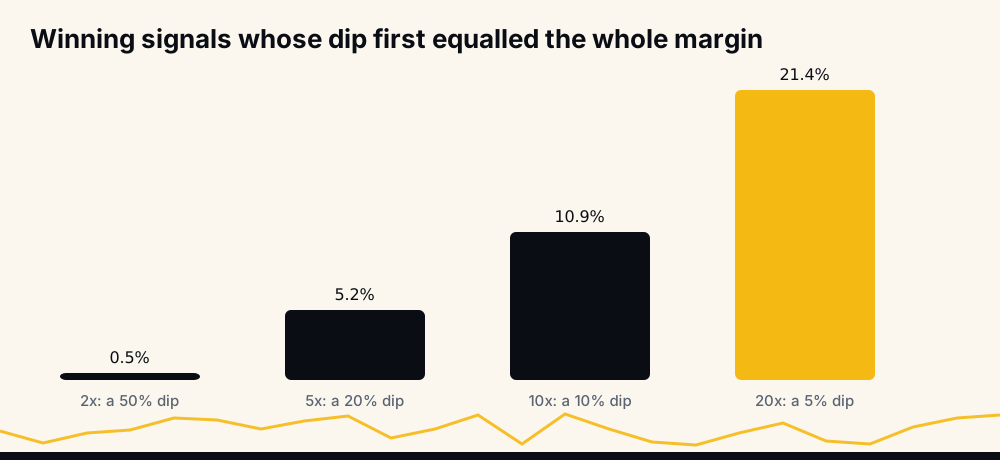
Line the leverage up against the drawdown column and the archive's winners look like this:
- At 2x, a 50% dip takes the margin: 0.5% of winners went that far first.
- At 5x, a 20% dip: 5.2% of winners.
- At 10x, a 10% dip: 10.9% of winners, roughly one in nine.
- At 20x, a 5% dip: 21.4% of winners, roughly one in five.
Treat these as a floor, not an estimate. They assume isolated margin, measure from the reference entry, and ignore fees and the exchange's maintenance margin, all of which bring liquidation sooner. The chart is arithmetic on the file, not a simulation of anyone's account.
The practical reading: a signal can be "right" and still close your position at a total loss before it gets there. That is why the stop-loss and position size decide the outcome far more than the headline rate. How to set a stop-loss in crypto and how leverage trading works cover the mechanics.
The 613 signals still open at the cut
The 1.8% that were still open at their month's cut are the other half of the picture, and they look nothing like the winners.
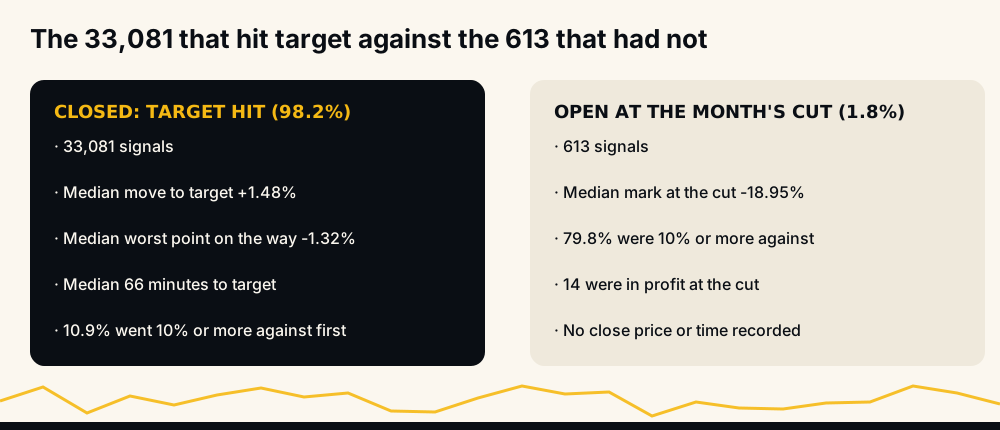
Their median mark at the cut was −18.95%, unleveraged. 79.8% of them were 10% or more against their entry, and only 14 were in profit. The archive records no close for them: no target, no stop. A trader who held them without a stop was carrying losses many times the size of a typical win.
Later price history shows most of them were not lost: about three in four reached their own target eventually, a median 67 days after entry, and members who averaged into repeat signals with a merged take-profit saw 99% of those positions close at the combined target, usually within a week (the full recount). The cost was the drawdown on the way, which is where leverage decides the outcome. The realistic win rate article does the expectancy arithmetic on the same file.
Does signal strength change the hit rate?
Each signal carries a public strength rating from 0 to 5. The earliest months predate the rating, so 5,289 rows have none.
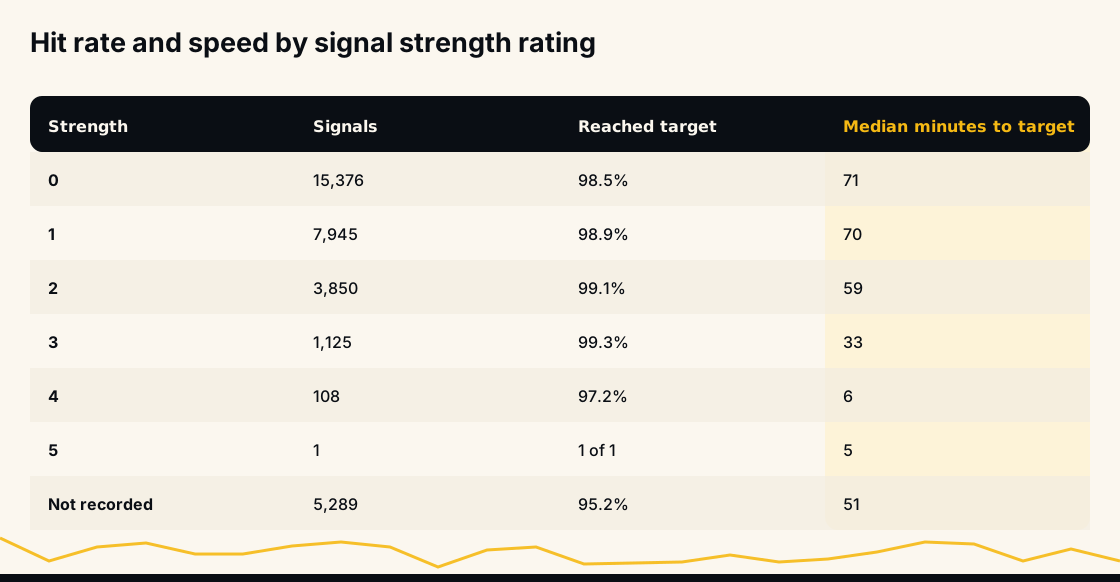
The hit rate rises gently from strength 0 (98.5% of 15,376) to strength 3 (99.3% of 1,125), then falls to 97.2% at strength 4, where there are only 108 signals. Strength 5 fired exactly once. The unrated rows sit at 95.2%; they all come from June 2021 to March 2022, a stretch that holds five of the seven months under 95%.
The clearer difference is speed. The median time to target falls from 71 minutes at strength 0 to 33 minutes at strength 3 and 6 minutes at strength 4. Higher ratings are also much rarer, so choosing a minimum strength trades volume for pace. The strength-4 sample is too small to lean on.
Longs versus shorts
The archive is heavily long: 29,296 long signals (86.9%) against 4,398 shorts (13.1%).
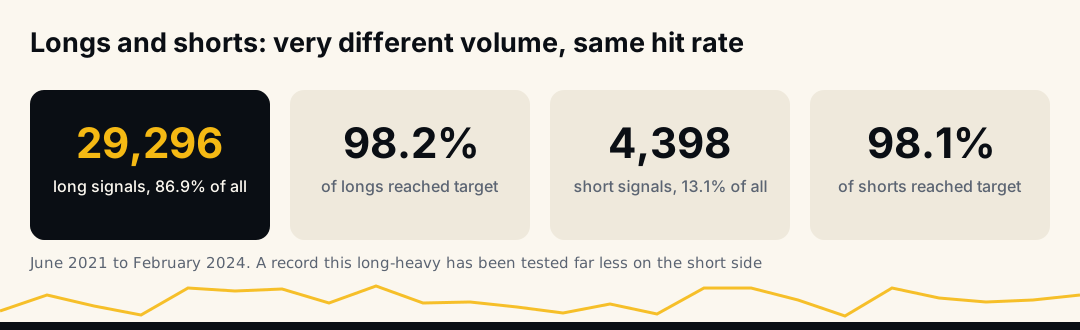
The hit rates are almost identical, 98.2% for longs and 98.1% for shorts. The imbalance is the finding. A record built mostly from long exposure has been tested far less on the short side, so a short signal from this archive rests on a sample less than a sixth the size.
How to read any provider's win rate
Everything above generalises. Whoever you are evaluating, ourselves included, a win rate is a claim until you know how it was counted.
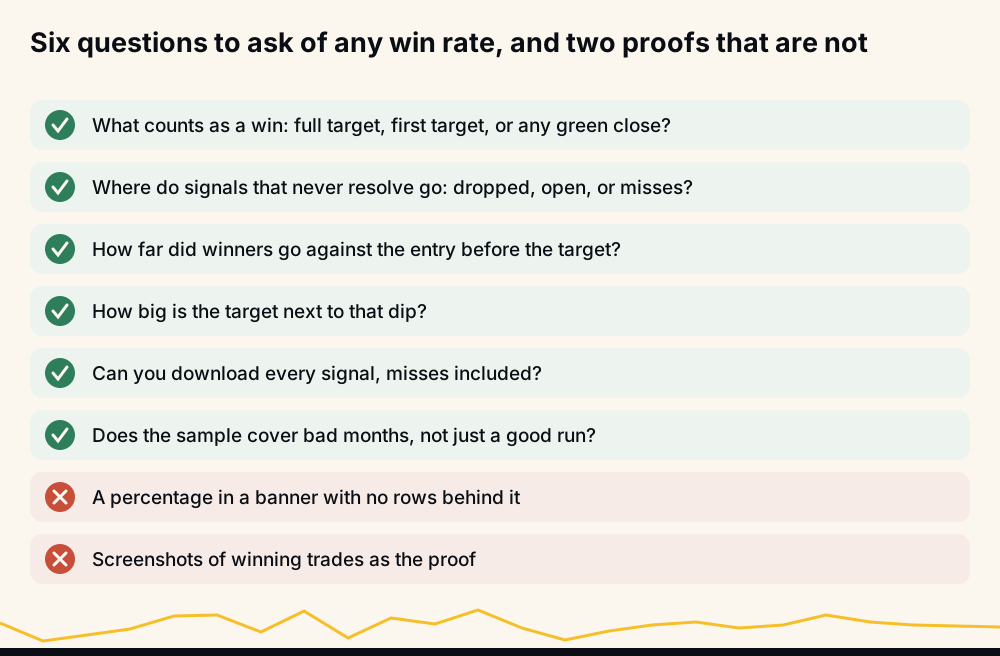
- What counts as a win? Full target, first of several targets, or any close in profit? A first-target win on a three-target signal is a much lower bar.
- What happens to signals that never resolve? Dropped from the count, left open, or scored as misses? Our archive leaves them open; the live record scores them as misses.
- How far did winners go against the entry first? Without this, you cannot size a stop or choose leverage.
- How big is the target next to that dip? A 1.5% target and a 1.3% typical dip are a very different bet from a 5% target with the same dip.
- Can you download every signal, misses included? A rate you cannot recount is marketing.
- Does the sample include bad months? A few weeks of a rising market prove little.
A percentage in a banner and a folder of winning screenshots answer none of these. How to verify a crypto signal win rate turns the list into a step-by-step audit.
What the live record counts differently since June 2026
The archive stops in February 2024. Since June 2026, the live performance page is generated hourly from the same table the bot writes when it sends a signal, and it uses a stricter rule. A win hit its target, a loss hit its stop, and an expired signal reached its maximum hold with neither. The target-hit rate is wins ÷ (wins + losses + expired), so an expired signal counts against it, and signals still open are left out until they resolve.
Under that rule the full months so far read 94.3% for June 2026, 88.3% for July and 91.0% for August (as shown on the page on 30 September 2026). Those are lower than the archive, and they should be: the archive had nowhere to put a signal that stalled, and the live page does. What happens when a crypto signal expires explains the expiry rule, and how results are counted gives the definitions in full.
How to reproduce these numbers
Nothing here needs our cooperation.
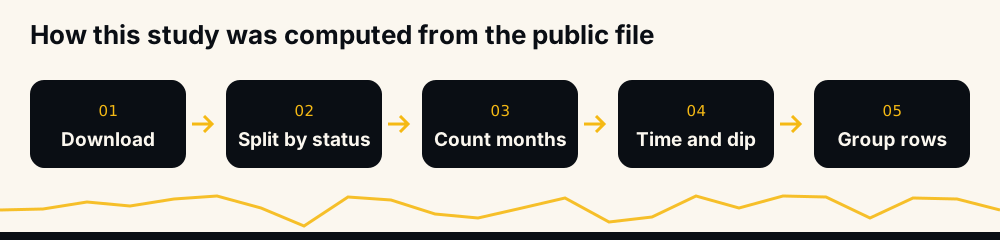
- Download the CSV from /data.
- Split rows on
status: closed versus open. Compute nothing before this step; the largest losses in the file are open-row snapshots, not closed trades. - Count closed over all rows, overall and per
month. - For closed rows, take
close_timeminusentry_timefor speed,pnl_pctfor the move, andpnl_min_pctfor the worst point on the way. - Group by
strengthandside.
Two cautions. Some rows share a pair and entry time, because more than one signal fired together; count rows, as the reports do. And every return is per signal, unleveraged and unsized, so none of it is an account result. Why your results differ from the provider's covers the gap between a signal record and a real account.
Frequently asked questions
How often do crypto signals hit their target? It depends entirely on how far away the target is and how the provider counts. In our 2021–2024 archive, 98.2% of 33,694 signals reached a target whose median distance was 1.48%, under a rule where unresolved signals stay open rather than count as misses. On the stricter live record since June 2026, full months have read 88.3% to 94.3%.
What is a good crypto signal accuracy? There is no single good number, because accuracy trades against target size. A service aiming for 1–2% moves can hit very often and still lose money if its misses are large. Judge the rate next to the average win, the average loss and how far winners dip first.
Why is a 98% hit rate not the same as profit? Because the wins are small and the misses are not. In this archive, the median target hit was worth 1.48% unleveraged, while the 613 unresolved signals were a median 18.95% down at their month's cut. With leverage, 10.9% of the winners went far enough against at 10x to take the whole margin before turning.
Do stronger signals hit their target more often? Slightly, up to a point. Strength 3 reached target 99.3% of the time against 98.5% for strength 0, but strength 4 fell to 97.2% on only 108 signals. The bigger difference is speed: median time to target was 33 minutes at strength 3 against 71 at strength 0.
Can I download the data behind this study? Yes. The full file of 33,694 rows is free at /data as CSV or JSON, with a column guide, and the original monthly spreadsheets are on /reports. If you publish something built on it, the data page gives a citation line.
Sources and how to cite this study
HafizeBot's AI-generated signals are built from 240+ indicators, formulas and components. We do not publish how; we publish what happened, signal by signal. The archive is at /data and /reports, the stricter live record at /performance, and the signals themselves arrive in the free Telegram channel before anyone pays for anything.
To cite the underlying data: HafizeBot (2026). Binance USDT-M futures signal archive, June 2021 – February 2024, 33,694 rows. https://www.hafizebot.com/data
A past hit rate does not predict your results, and nothing in this study is investment advice. Crypto futures carry a high risk of loss, and leverage can take the whole deposit; trade only with money you can afford to lose.