There is no single number, and any bot that gives you one is guessing. What a crypto trading bot makes is decided by four things you control — how often it trades, how often it is right, how far price travels on each result, and how large each position is — minus fees, funding and slippage. Below is that arithmetic, plus 33 months of published figures to plug into it.
Every competing answer to this question on the first page of search results is a number with nothing behind it: $100 a day, 10% a month, 3% a week. None of them state a position size, so none of them mean anything. A return is a fraction, and a fraction without a denominator is a mood. What follows is the denominator.
The formula that decides what a bot makes
A bot's monthly result is not a property of the bot. It is the output of five inputs, four of which are yours.
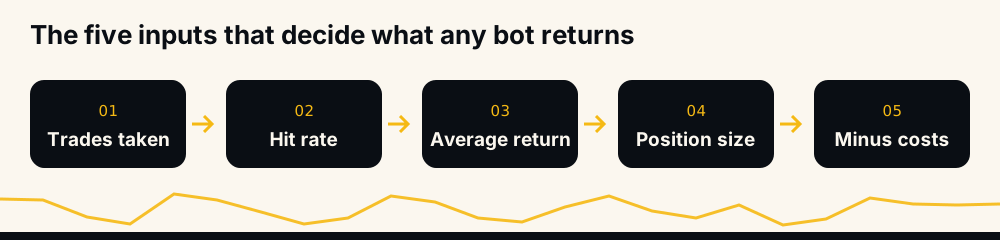
- Trades taken. How many signals you actually acted on. Half the signals, roughly half the result.
- Hit rate. The share that reached their target rather than their stop.
- Average return per trade. The mean price move across every closed position, winners and losers together.
- Position size. What fraction of the account each trade represents.
- Costs. Fees on both legs, funding on anything held, slippage on the fill.
Multiply the first four, subtract the fifth. Everything else in this article is a way of getting honest values into those five slots. Note what is not in the formula: the bot's marketing, its logo, or how confident its owner sounds.
What 33 months of published returns actually show
Between June 2021 and February 2024, HafizeBot published one spreadsheet a month — 33 of them, 33,694 signals, all downloadable at our published reports. Each sheet carries a column called return at 1% position sizing: the month's result if every single signal had been taken at 1% of the account, unleveraged and without compounding.
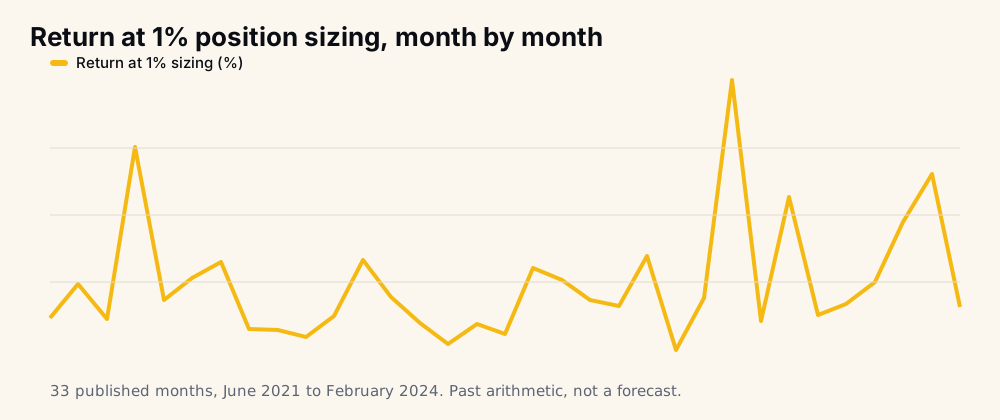
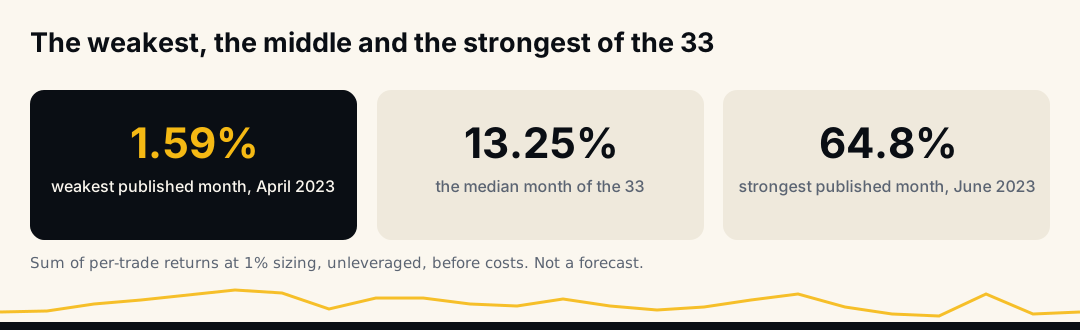
The shape of that line is the honest answer to the headline question. Across the 33 months the figure ranged from 1.59% to 64.8%, with a median month of 13.25%. It is not a smooth curve, it is not a forecast, and it is not what any particular account made. It is arithmetic on a published record, and you can redo it yourself from the sheets.
Look at a single year rather than the whole series and the variance is even clearer.
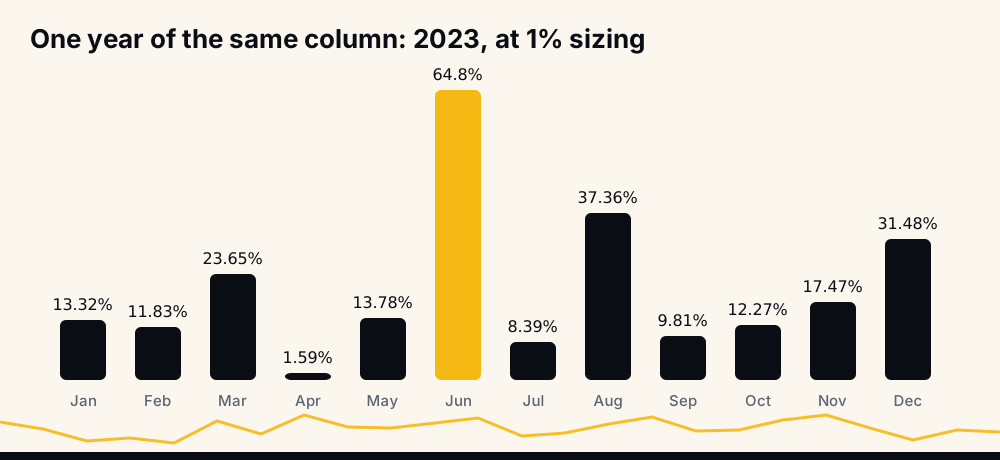
April 2023 produced 1.59%. Two months later, June 2023 produced 64.8%. Same signals, same method, forty times the difference. Anyone quoting a single monthly percentage as the number a bot makes has either not looked at a series like this or is hoping you will not.
What "return at 1% sizing" does and does not mean
This is the part that most performance claims skip, so it is worth being blunt about the assumptions inside that column.
It means: sum the percentage move of every closed trade in the month, and size each one at 1% of the account. It is unleveraged. It does not compound — month two starts from the same base as month one. And critically, it assumes every signal was taken, which requires enough free capital to hold that many positions simultaneously. A month with 2,578 signals is not a month a small account could have mirrored.
It also means the figure scales with your sizing decision, not with ours. At 0.5% per position the same months halve. At 2% they double — and so does every drawdown inside them. The column is a unit of measurement, not an outcome, which is exactly why the field name carries the position size in it.
The months that matter most are the weak ones
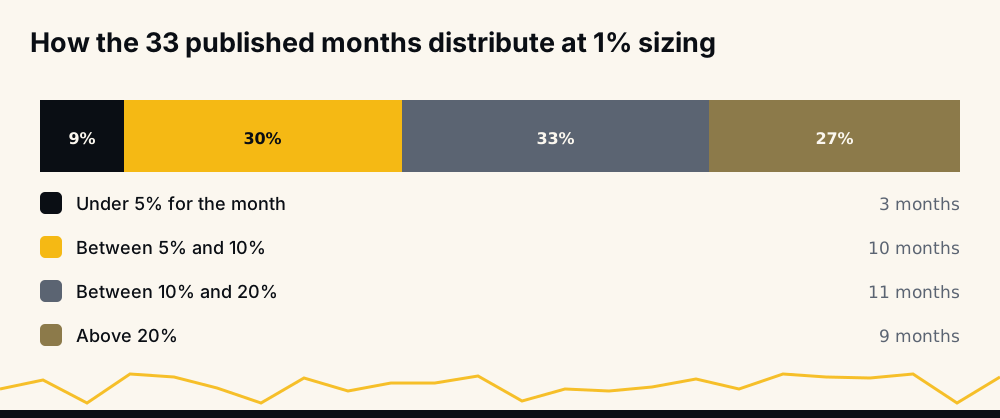
Three of the 33 months came in under 5%. Ten more landed between 5% and 10%. That is thirteen months — nearly 40% of the record — where the answer to "how much did the bot make?" was not much, at that size.
The hit rate tells the same story from the other side. Across those sheets the monthly accuracy ran from 92.4% at worst to a median of 98.9% as reported in those spreadsheets — and the worst months, June 2021 at 92.4%, September 2021 at 93.4% and August 2022 at 93.6%, are the informative ones. A high hit rate is not a guarantee of a strong month, because the size of the losses matters as much as their count. August 2022 hit 93.6% and still only produced 3.08% at 1% sizing.
That is the practical lesson: judge a system by the shape of its weak months, because those are the ones you will have to sit through.
Fees: the bill that arrives whether you win or lose
Binance USDT-M futures charge roughly 0.02% maker and 0.05% taker. A taker round trip is therefore about 0.10% of the notional you traded — charged on entry and exit, win or lose.
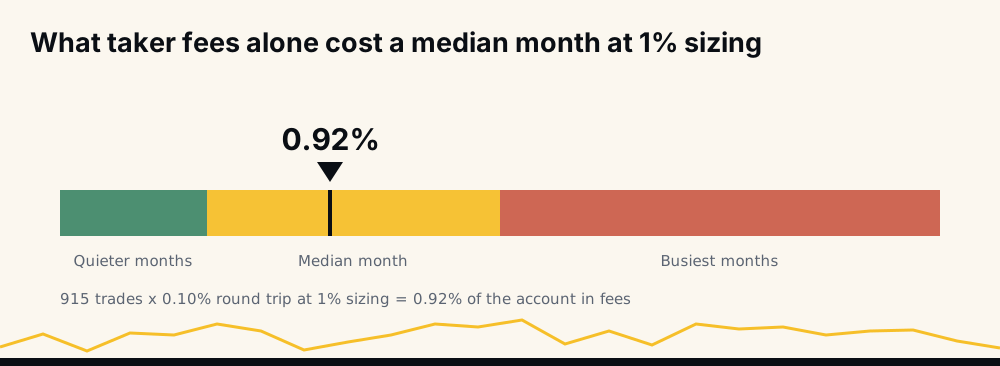
Now put that into the 1% sizing frame. Each position is 1% of the account, so each round trip costs 0.001% of the account. The median published month contained 915 signals. Take all of them at taker rates and the fee bill is about 0.92% of the account — roughly a fourteenth of that month's 13.25%. In the busiest month, 2,578 signals, the bill is about 2.58 points against a gross of 42.87%.
That is survivable but not trivial, and it is the single easiest cost to forget, because it never appears on a chart. The full accounting of exchange and network costs is in blockchain transaction fees. Two things reduce it: fewer, more selective trades, and limit orders where the entry allows, since maker at 0.02% is a 60% discount on that line.
Funding and slippage: the costs a spreadsheet never sees
Perpetual futures charge funding, typically every eight hours, on the notional. At an example rate of 0.01% per interval that is about 0.03% a day on a held position — small on a trade that closes in hours, meaningful on one held for a week, and occasionally much larger when the rate spikes in a crowded market.
Slippage is worse because it is invisible until it happens. The published sheets record the price a signal referenced; your fill is whatever the order book offered when your order arrived. On BTCUSDT that gap is usually negligible. On a thin altcoin perpetual during a fast move it is not, and it always works against you at exactly the moment you most want out. Slippage and why a buying and selling difference occurs covers the mechanism.
Leverage does not change any of this, but it magnifies all of it — fees, funding and slippage all scale with notional, not with margin. The full arithmetic of that is in how leverage trading works in crypto.
The leaks between a published number and your account
Beyond the costs, several ordinary things quietly shrink the result:
- Missed signals. You were asleep, the API was down, or your maximum-simultaneous-positions limit was already full.
- Delay. Free-channel signals arrive 20 minutes after VIP members get them. Twenty minutes is nothing on a slow move and everything on a fast one.
- Capital limits. A month with 2,500 signals assumes you could hold dozens of positions at once. Most accounts cannot.
- Sizing errors. Doubling up on the trade you liked and skipping the one you did not is a different strategy, with different results.
- Overrides. Closing early, moving a stop, or sitting out after two losses — all of which feel like risk management and none of which are in the published number.
Each of these is small. Together they are the entire gap between what a record shows and what an account does.
Why advertised bot returns are usually meaningless
There is no accounting standard for a trading bot's advertised return, which is why the numbers you see are incomparable to each other and to reality.
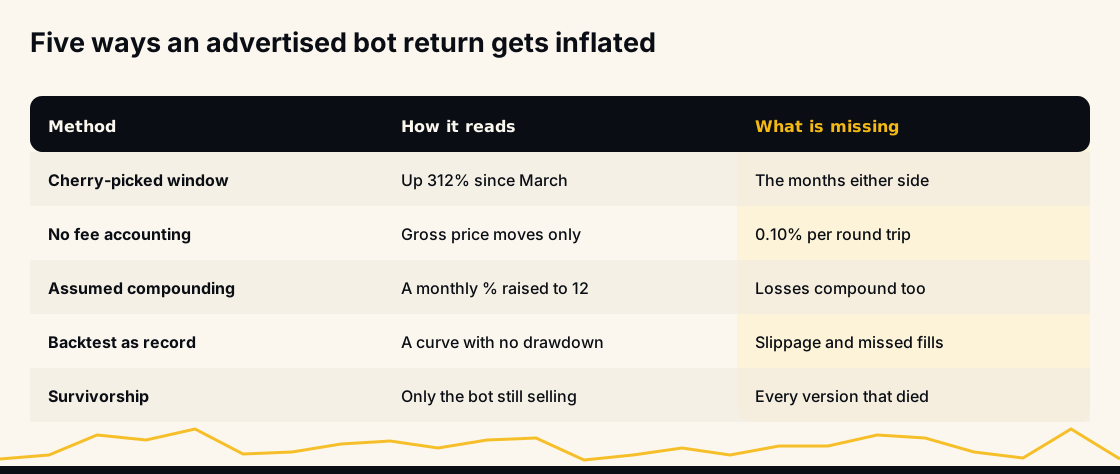
The compounding trick deserves special mention. Take a good month, raise it to the twelfth power, print the result as an annual figure. Compounding is real, but it works in both directions and it assumes you keep sizing up into a losing streak, which is precisely the behaviour that ends accounts. A more detailed version of this scepticism is in are crypto trading bots worth it.
Why a backtest overstates what a live account does
A backtest is a story told by someone who knows the ending. Even an honest one flatters, because the simulator's assumptions are all gentler than a real exchange.
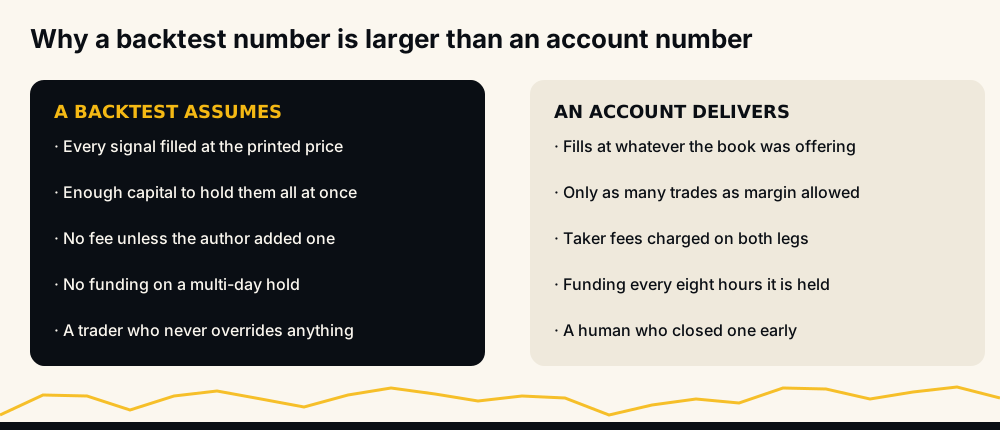
The gap is not usually fraud. It is that fills, capital limits, fees, funding and human interference each cost a little, and they compound into a lot. Treat any curve that has never touched a live order book as an upper bound — the best case, minus everything above. Whether an automated system beats a discretionary one is a separate question, examined in do AI crypto trading bots actually work.
The trader is the biggest variable in the formula
Two people can run the same signals for the same month and end up hundreds of percent apart, and the difference is rarely the signals. It is sizing, selection and patience.
Automation removes a large slice of that. A rule executes at the same size at 4am as at noon, does not widen a stop out of hope, and does not skip the trade after three losses. What it cannot remove is the decision to override it, which is the most expensive habit in retail trading and the one that no published record can account for. If you are weighing whether the automation is worth it at all, is crypto trading passive income takes that question apart.
Two scoreboards, counted differently
There are two HafizeBot records, and they are measured in different ways. Saying so plainly is the point.
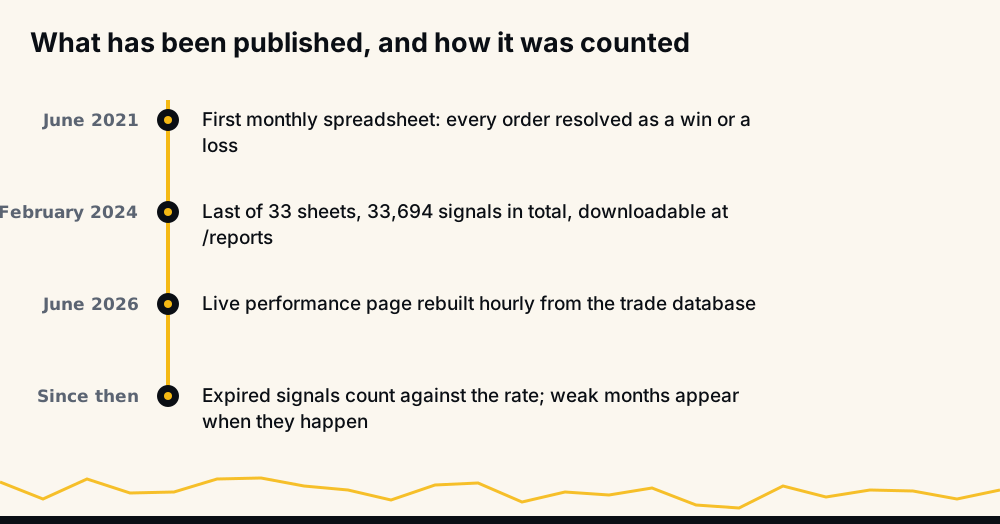
The 33 spreadsheets have no missed category at all: a signal stayed open until its target, and only those still open when the month's sheet was cut counted against it, which is a large part of why the median reads 98.9% as reported in those sheets. Since June 2026 the live performance page is regenerated hourly from the trade database under a stricter definition: a win is a target hit, and the page shows Wins, Missed and Open. Broadcast signals carry a target and a maximum hold, not a stop, so every signal that does not reach its target in time counts as Missed and lowers the rate. On that basis the settled months have run between 97.2% and 98.4%, every month under the same hold, with PnL shown unleveraged. With no stop on broadcast signals there is no Losses column; read Missed as the misses. Where you cut a loser is your decision.
Those two figures are not comparable, and comparing either one to a competitor's advertised number is comparing different accounting entirely. When you evaluate any provider, the first question is not "what is your win rate" but "how do you count a trade that did neither".
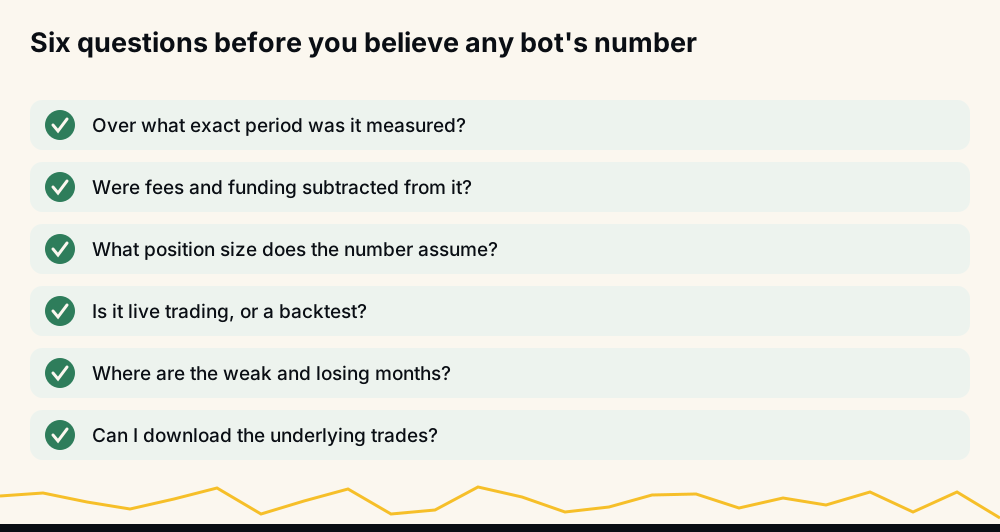
How to check a claim before you believe it
Where a claim lands on two axes — how checkable it is, and how spectacular — tells you most of what you need before reading a word of the copy.
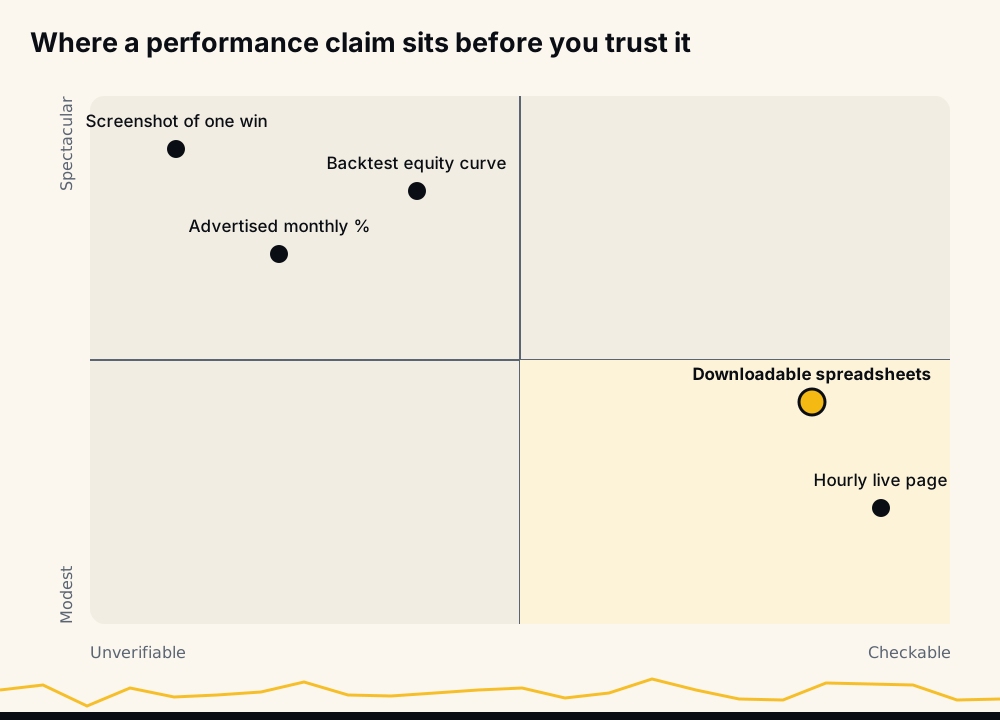
The bottom-right corner is where trustworthy claims live: modest, and checkable. Anything in the top-left is an advertisement.
What you can actually control
You cannot control what the market pays. You can control every other term in the formula: how many signals you take, at what size, with what leverage, at what cost per round trip, and whether you leave the system alone once it is running.
HafizeBot produces AI-generated signals from a model that evaluates 240+ indicators, formulas and components across 500+ Binance USDT-M perpetual pairs, rating each by strength. Autotrading never needs withdrawal permission on your Binance API key, so funds stay on your own account, and the limits are yours to set: minimum signal strength, position size, maximum simultaneous positions and coin filters. Those settings are the sizing term in the formula, which is the term with the most leverage over your result.
Before paying, watch the signals of strength 3 and up arrive 20 minutes late on the free Telegram channel — around 3,940 members as of September 2026 — and score them against the performance page's matching rows. A few weeks of that will tell you more than any advertised percentage. If you want the vocabulary for reading each message first, how to read crypto signals covers it.
None of this is investment advice, and nothing above is a projection of what you or anyone else will earn. Leveraged crypto trading can cost you the entire deposit, so trade only what you can afford to lose, and treat every historical figure here — including ours — as a description of the past rather than a promise about the future. The broader framework for sizing against that uncertainty is in what is financial risk.
Frequently asked questions
How much do crypto trading bots make per month? There is no standard answer, because the result depends on your position size, how many signals you take and what you pay in fees. On HafizeBot's 33 published monthly spreadsheets, the return at 1% position sizing ranged from 1.59% to 64.8% with a median of 13.25% — arithmetic on a past record, unleveraged and before costs, not a forecast of anyone's account.
Can a trading bot make $100 a day? Only with a stated account size, and the claim is meaningless without one. $100 a day is a rounding error on a large account and an impossible target on a small one. Any figure quoted in currency rather than as a percentage of capital is hiding its denominator, and figures quoted as percentages still say nothing about the drawdown taken to reach them.
Do trading bot returns include fees? Usually not, and you should assume they do not unless it is stated. A taker round trip on Binance USDT-M futures costs about 0.10% of notional, plus funding of roughly 0.01% per eight-hour interval on anything held. At 1% position sizing across a 915-trade month, fees alone come to about 0.92% of the account.
Why do bots have losing or weak months? Because market conditions change and no system fits all of them. Even with a high hit rate, a handful of large losses can flatten a month — August 2022 recorded 93.6% accuracy and still produced only 3.08% at 1% sizing. Any record without weak months in it has either been running for a very short time or is not showing you everything.
How can I verify a bot's advertised returns? Ask for the underlying trades, the exact date range, the position size assumed and whether fees were deducted. Then check whether losing outcomes are counted honestly: HafizeBot's performance page counts expired signals against the hit rate, and the monthly reports are downloadable so you can recompute the columns yourself.
Is a higher win rate the same as a higher return? No, and confusing the two is the most common mistake in this category. Return is hit rate multiplied by average outcome size, so a system that wins 95% of the time with small targets and occasional deep losses can easily underperform one that wins less often but loses smaller. Always read the two numbers together.