Can an AI signal bot beat the market? Nobody can show that from a hit rate, and that includes us: our 2022 record says how often 11,670 signals reached their target, as reported in those spreadsheets, but a hit rate is not a market return, so it cannot prove that HafizeBot, or anyone following it, outperformed the crypto market that year. This page shows what the record does say, how we counted it, and how you can count it yourself.
Updated 11 October 2026. This address used to carry a short 2023 article claiming that our models had outperformed the crypto market and delivered significant profit for users in 2022. We replaced it, because the record behind it measures signals, not accounts, and nothing in it compares anything with the market. What follows is the same year, described with the numbers we can actually defend.
The short answer: no record of hit rates can prove it
People ask whether AI can beat the market because the question sounds like it has a yes or no answer. It does not, until you say which market, over which dates, against which benchmark, with which costs and how much risk. "Beat the market" is a statement about returns. A signal service's headline is almost always a statement about hits.
Those are different measurements. A hit rate counts how often price reached a target. A market return measures how much an account grew compared with, say, simply holding Bitcoin over the same period. You can have a very high hit rate and a worse return than the market, or a modest hit rate and a better one. The first number does not contain the second.
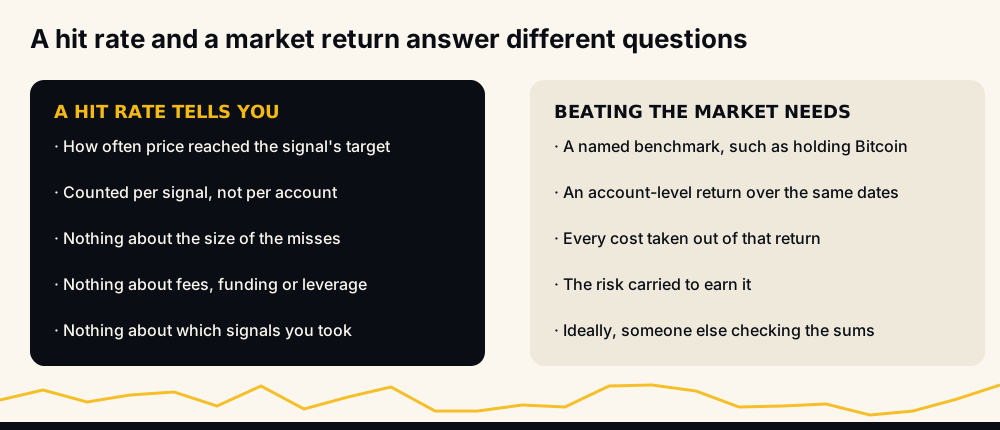
So the honest answer for HafizeBot is short: our 2022 sheets show a high share of signals reaching target, and they cannot show whether anyone beat the market. If a provider tells you their AI outperformed the market and the only evidence is a win rate, the claim is bigger than the evidence. That was true of the old version of this page too.
What HafizeBot published for 2022
Between June 2021 and February 2024 we published one spreadsheet a month listing every signal sent. Twelve of them cover 2022. All of them are downloadable from the monthly reports page, and the same rows are flattened into one file on the signal dataset page.
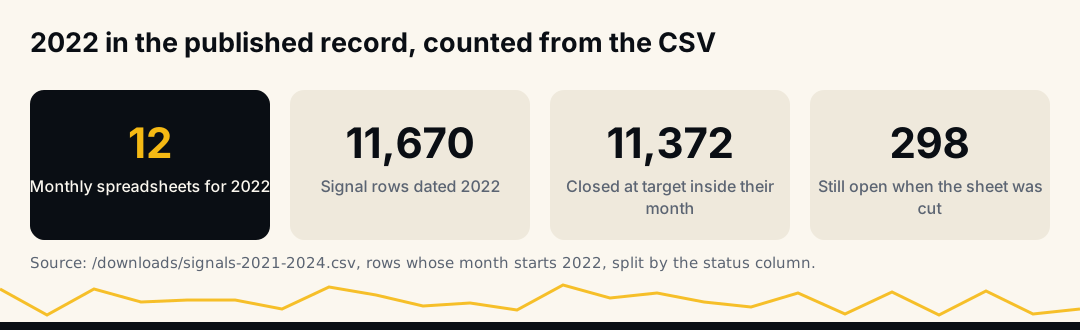
Here is what the 2022 slice contains, counted from that file:
- 11,670 signal rows whose
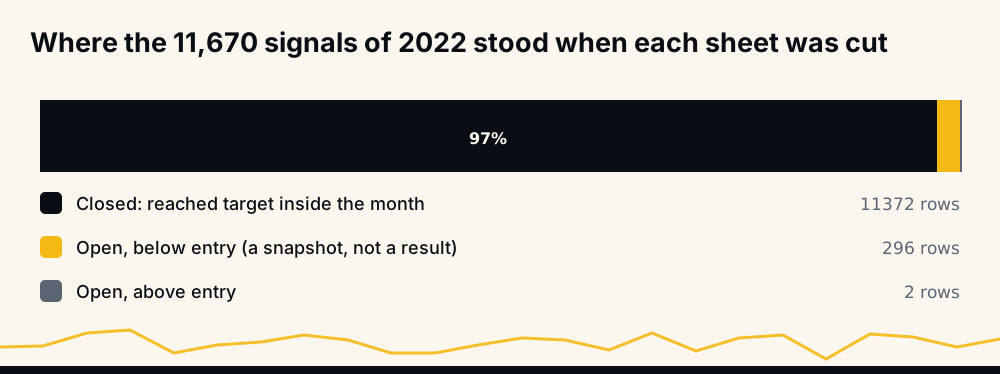
monthcolumn starts with 2022. The twelve monthly counts on the reports page add up to the same total. - 11,372 rows marked closed, which in these sheets means the signal reached its target inside its month. That is 97.4% of the year's rows.
- 298 rows marked open: signals still running when that month's sheet was cut. 296 of them sat below entry at that moment and 2 sat above it.
- 159 different pairs, all Binance USDⓈ-M futures, and 10,521 longs against 1,149 shorts.
The monthly report pages count the same way, so your recount should match them. Since 11 October 2026 a row counts as reaching target there only if its sheet recorded a close, and every row still open at the cut counts against its month, whatever its mark at that moment. Their twelve months add up to 11,372 signals that reached target in 2022, 97.4%, the same as the closed count in the file. Before that change the pages also counted the two open rows that sat above entry at the cut, and read 11,374 (97.5%).
Month by month: best, worst and busiest
The monthly rates below are the ones the reports page shows for each 2022 sheet, closed rows over all rows, as reported in those spreadsheets: January 94.3%, February 99.1%, March 97.4%, April 98.0%, May 97.3%, June 97.8%, July 99.8%, August 93.6%, September 94.1%, October 98.2%, then November 98.9% as reported in the sheet, and December 100.0%.
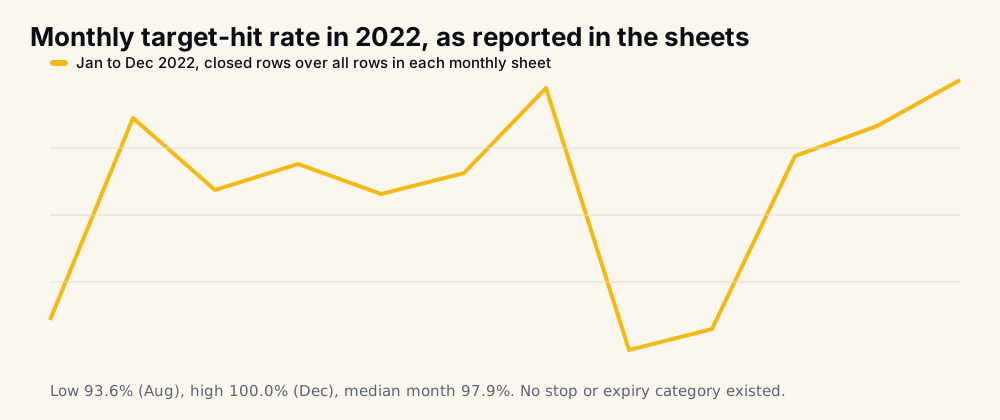
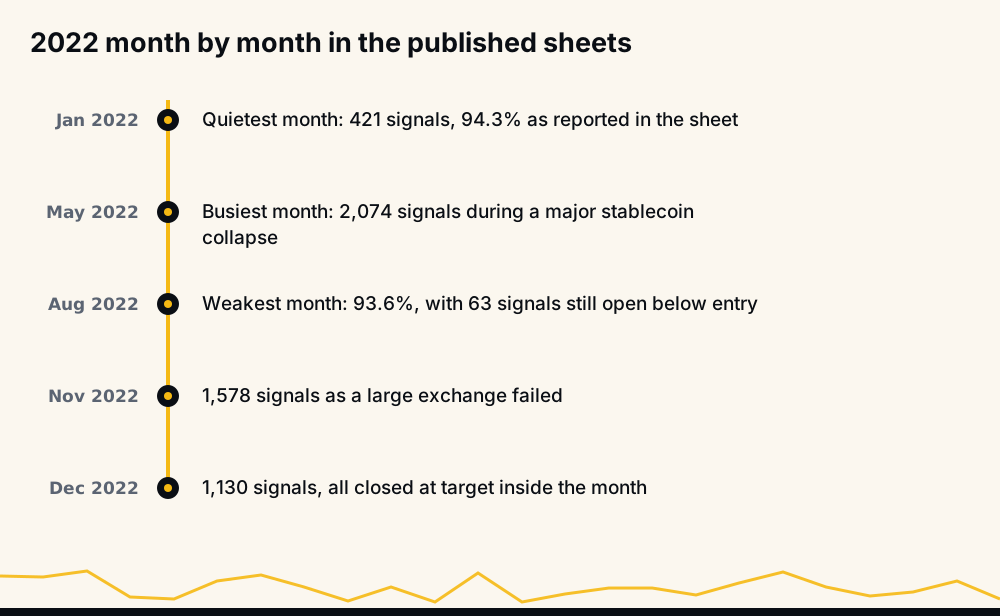
- Weakest month: August, 93.6%. Of its 984 signals, 63 were still open below entry when the sheet was cut. September (94.1%) and January (94.3%) were the next two weakest.
- Strongest month: December, 100.0%. All 1,130 signals closed at target inside the month, so there were no open rows to count against it.
- Median month: 97.9%, the middle of the twelve monthly rates (halfway between June's 97.8% and April's 98.0%).
- Busiest month: May, 2,074 signals. Quietest: January, 421.
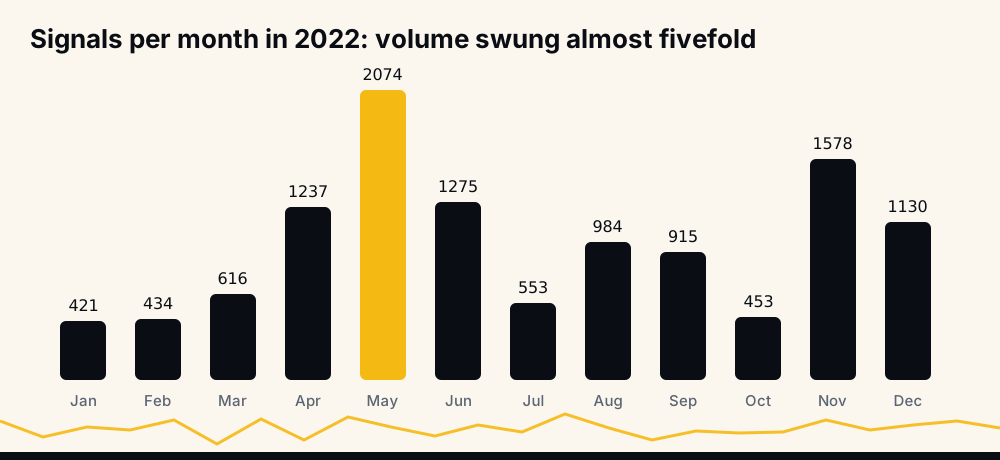
Volume swung almost fivefold across the year. That matters when you read a percentage: a month with five times the signals carries five times the weight in any yearly total, and a reader who averages the twelve rates gets a different answer from one who counts all the rows. The dataset page says it plainly: a month with more rows is a more volatile month, not a better one.
What 2022 was like for crypto
2022 was a bear market for crypto, and a hard one. Bitcoin and most large coins ended the year far below where they started. Two well-known failures shook the whole market: a large algorithmic stablecoin collapsed in May, and a major exchange failed in November. If you want the background on what bull and bear markets are, our older explainer on the difference between a bear and a bull market covers it.
It is tempting to put the two facts side by side, a falling market and a high hit rate, and call the difference outperformance. That is exactly the step the evidence does not support. A signal that reaches a small target in a falling market tells you the price moved that far at some point after entry. It says nothing about what an account holding those positions, sized and leveraged and charged fees, earned compared with someone who held Bitcoin all year.
The two busiest months, May and November, line up with the year's two big shocks. We note that without claiming more: the sheets record what was sent, not why the market moved.
Why a hit rate is not a return
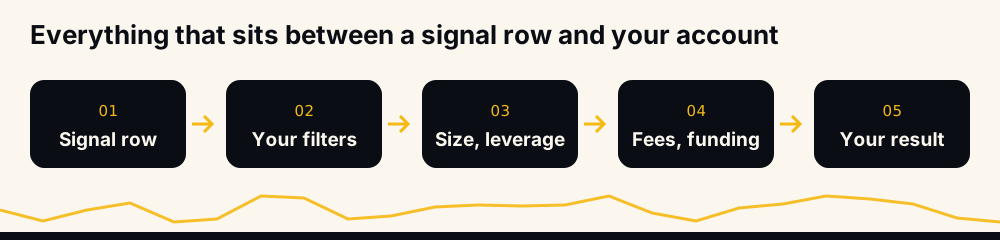
Four things sit between a hit rate and a return, and none of them appears in the rate.
The size of a hit against the size of a miss. In the 2022 rows, the closed signals moved a mean of +1.79% and a median of +1.35%, unleveraged. The 298 open rows, frozen at the moment each sheet was cut, sat at a mean of −25.88% and a median of −21.11%, and 262 of them (87.9%) were worse than −10%. Those open figures are snapshots, not results, because the sheets do not record how those signals ended. But they show the shape: many small hits, a few large misses.
Leverage. Every number in the file is unleveraged. At 5x, the median open snapshot of −21.11% is more than the whole margin, so an isolated position would have been liquidated before it ever got there. Leverage multiplies hits and misses alike; our guide to how leverage trading works walks through the liquidation arithmetic.
Fees and funding. Each trade pays a fee to open and to close, and futures positions pay or receive funding while they are open. Purely as an illustration, a round trip that cost 0.1% of the position would take about 7% of a +1.35% move. Check the real rates on your own Binance fee page before you rely on any figure; what crypto trading bots actually make goes through the costs line by line.
What you actually entered. In May 2022 there were 2,074 signals. No real account takes all of them at the same size at the same moment.
A rough break-even from the 2022 rows
There is one useful piece of arithmetic you can do with the year's own numbers. If the average hit is W and the average miss is L, the hit rate at which the two cancel out is L ÷ (W + L).
Using the 2022 file, W is the closed mean of 1.79 and L is the open-snapshot mean of 25.88. That gives 25.88 ÷ (1.79 + 25.88) ≈ 93.5%. The year's closed share was 97.4%, about four points above that line. August, at 93.6%, sat almost exactly on it.
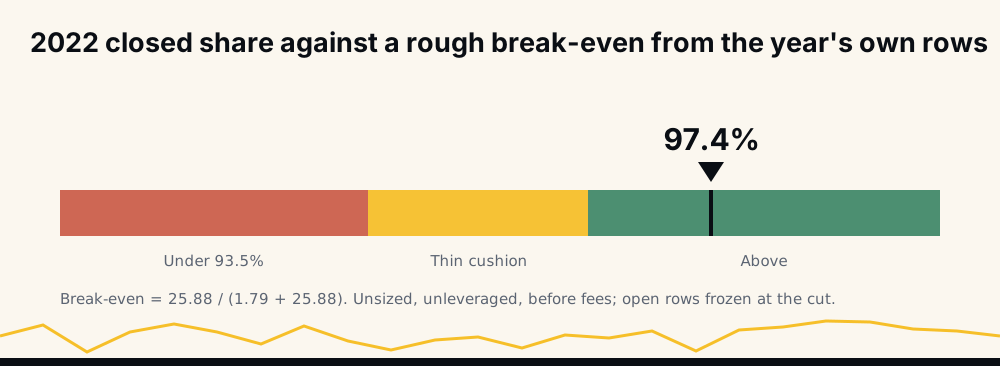
Read that as a sketch, not a P&L. It is unsized, unleveraged and before fees, and it treats each open row as if it had ended where the sheet froze it, which it did not. What it does show is why a rate in the high nineties is not the comfortable margin it sounds like. The cushion is the gap to break-even, not the distance to zero. Our longer piece on what a realistic crypto signal win rate looks like does the same arithmetic across all 33 months.
The other numbers on the reports page, and what they are not
The reports page also shows a "Sum at 1%" column for every month. It adds each signal's unleveraged move as if each were sized at 1% of an account. The page itself says it is not a return anyone could have earned, because it assumes every signal was taken at once. We agree, and it should never be quoted as a profit figure.
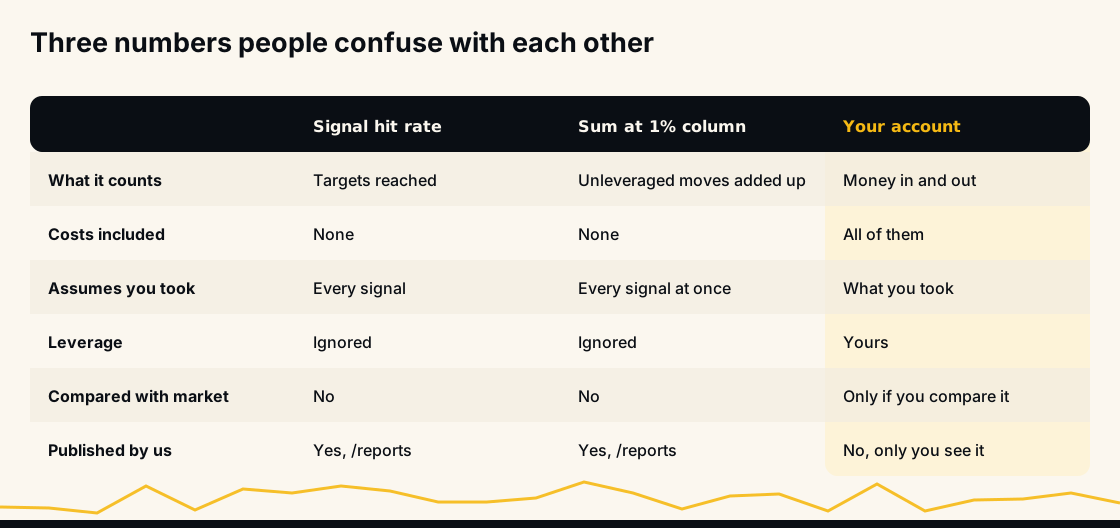
The 2022 sheets also had no stop or expiry category. A signal either closed at its target inside the month or showed up as open at the cut. So "none was stopped out" is a fact about how those sheets were kept, not an achievement. The live page we run today counts differently, which is the next section.
How today's record differs from 2022
Since June 2026, the live performance page is rebuilt every hour from the trade database. A win is a target hit, and the page shows Wins, Missed and Open. Broadcast signals carry a target and a maximum hold, not a stop, so every signal that does not reach its target in time counts as Missed and lowers the rate. As of 11 October 2026 it shows 97.3% for August 2026, the newest settled month, across 5,262 signals with 140 missed.
That is a stricter rule than the 2022 sheets used, and it still measures signals, not accounts. The live page says so in its own words: a target-hit rate is not account profit. So everything on this page applies to the live numbers too. They cannot show that anyone beat the market either.
If you want the whole three-year archive in context, our write-up of three years of published signals covers every month, the weak ones included.
What evidence could prove an AI beat the market
A real claim of outperformance would need four things together:
- A named benchmark, such as holding Bitcoin, or an index of the coins traded, over exactly the same dates.
- Account-level returns, not per-signal moves: real positions, real sizes, real leverage.
- Every cost removed: fees, funding, slippage on entry and exit.
- Independent checking, ideally by someone with no stake in the answer.
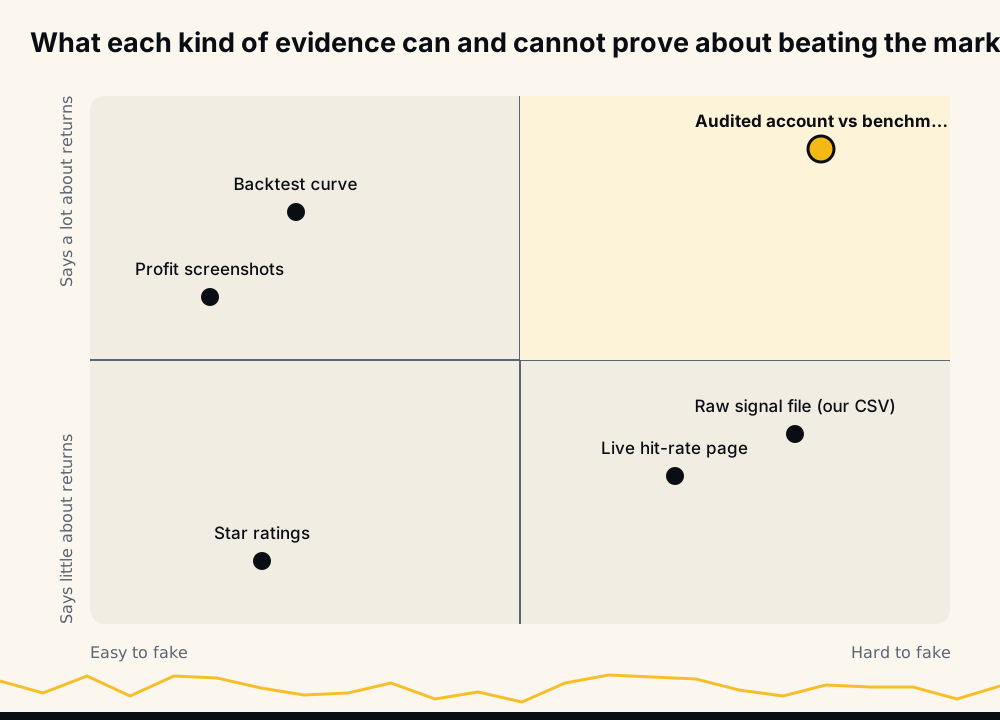
We do not have that for 2022, and we have no third-party audit of any record. What we have is the raw file, which is hard to fake because anyone can recount it, but which speaks to signals rather than to returns. Our guide on whether AI crypto trading bots actually work explains how to weigh the kinds of evidence providers show.
The signals themselves are AI-generated, from a model that evaluates 240+ indicators, formulas and components across Binance USDⓈ-M futures pairs. How it decides stays private. When you want proof, judge the published outcomes, never a description of the recipe.
How to check the 2022 numbers yourself
You do not need to trust any figure on this page. The file is free and small enough for a spreadsheet.
- Download the CSV from the signal dataset page.
- Filter the
monthcolumn to values that start with2022. You should have 11,670 rows. - Split by
status. You should see 11,372closedand 298open. - Within
open, count rows with a negativepnl_pct: 296. The other two are above entry. - Group by
monthand divide closed by total; compare each month with its page on the reports page. - For the break-even sketch, take the mean
pnl_pctof closed rows and of open rows separately.
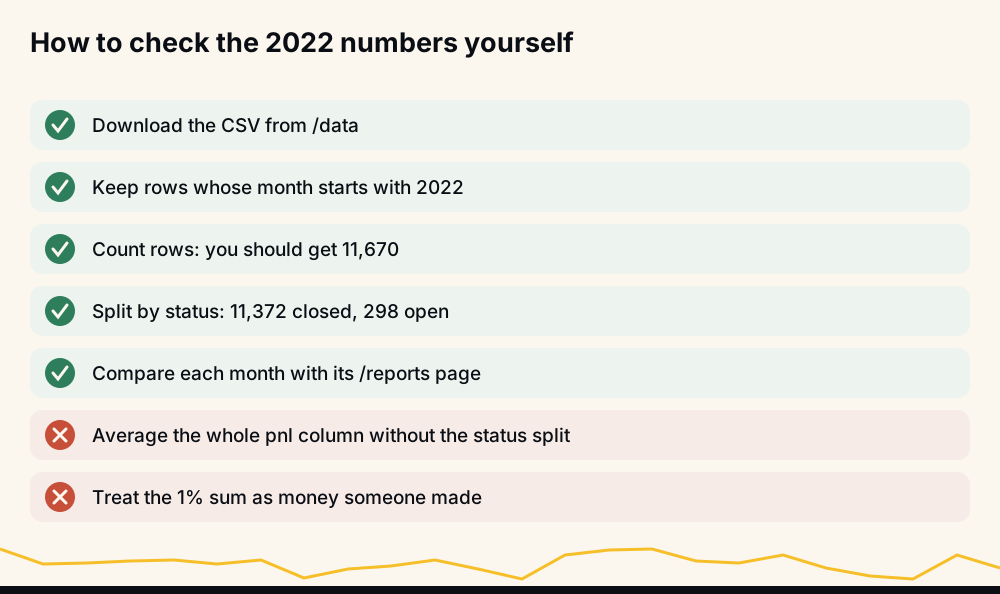
Two mistakes to avoid. Do not average the whole pnl_pct column without splitting by status, because the open rows are snapshots and will distort it. And do not read the 1% sum as money anyone made. If your counts differ from ours, tell us in @hafizebot; how to verify a crypto signal win rate has more checks of the same kind.
FAQ
Can AI beat the crypto market? Some strategies, AI or not, may beat a benchmark over some period, but you can only know that from account-level returns against a named benchmark, after costs, over the same dates. A hit rate cannot show it. Treat any "our AI beats the market" claim without that evidence as unproven.
Did HafizeBot outperform the crypto market in 2022? We cannot say that, and we no longer do. The 2022 sheets record 11,670 signals and how many reached their target, not what any account earned or how that compared with holding the market.
What was HafizeBot's hit rate in 2022? Counting the published CSV, 11,372 of 11,670 signals (97.4%) closed at target inside their month, and the monthly report pages add up to the same figure. Monthly rates ran from 93.6% in August to 100.0% in December, as reported in those spreadsheets.
Why can a high win rate still lose money? Because the size of the misses matters as much as how often you win. In 2022 the closed signals moved about +1.8% on average while the open snapshots sat near −26%, so the break-even rate was about 93.5% before fees and leverage. Leverage, costs and the signals you skip move your own break-even further.
Will I get the same results as the record? Probably not. Your filters, size, leverage, fees and timing all differ from a sheet that counts every signal equally; why your results differ from the signal provider's explains each gap.
Before you decide anything
If you want to judge HafizeBot, judge the record, not this page. Download the 2021 to 2024 dataset, read the live performance page, and watch the stronger signals, strength 3 and up, for free, 20 minutes late, in the free Telegram channel for a few weeks before paying anything.
Nothing on this page is investment advice, and past results, including the 2022 sheets, do not predict future ones. Crypto futures carry a high risk of loss. Only trade what you can afford to lose.