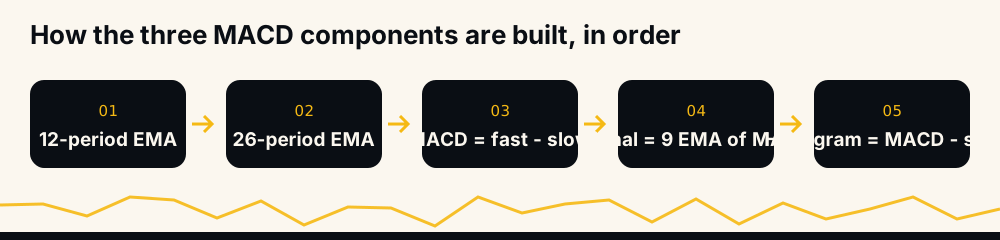
The MACD indicator — moving average convergence divergence — measures momentum by subtracting a 26-period exponential moving average from a 12-period one. That difference is drawn as the MACD line, a nine-period average of it becomes the signal line, and the gap between the two is plotted as a histogram. Traders read the crossings of those lines as shifts in momentum.
That is the whole mechanism. Everything else — crossovers, zero-line reads, divergence, settings arguments on Reddit — is interpretation layered on top of two subtractions. This guide covers each layer, then the part most tutorials skip: the market conditions in which MACD produces one bad signal after another.
What MACD stands for, and what it actually measures
MACD is short for moving average convergence divergence, and the name is a literal description. Two moving averages of the same price series move apart when momentum is building and move together when it fades. Convergence means they are closing on each other; divergence means they are separating. MACD simply plots the distance between them.
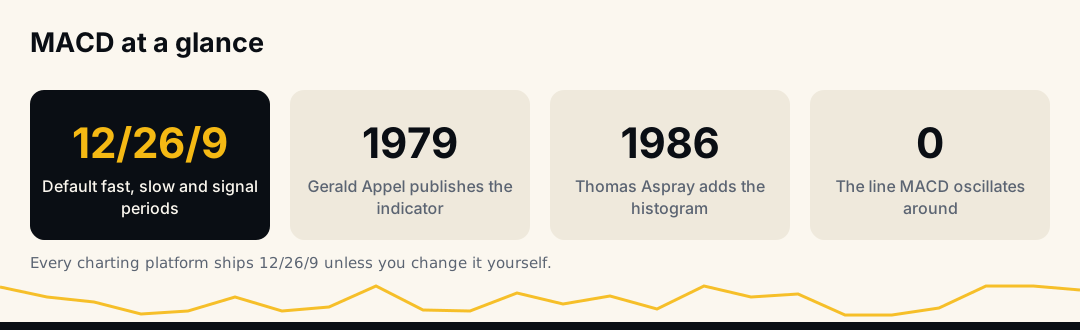
Gerald Appel developed the indicator in the late 1970s and published it in 1979. The histogram came later — Thomas Aspray added it in 1986 so traders could see the gap between the MACD line and its signal line changing before the two actually crossed.
Because every input is an average of prices that have already printed, MACD describes what momentum has been doing. It does not forecast. That distinction sounds pedantic until the first time a crossover fires two bars after the move you wanted to catch.
The three parts of the MACD indicator
A default MACD panel has three moving elements and one fixed reference:
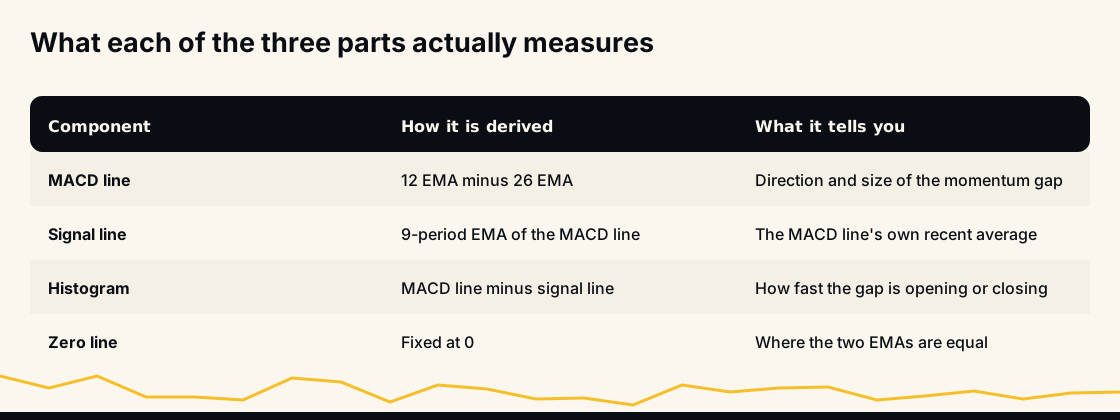
- The MACD line — the fast EMA minus the slow EMA. This is the momentum gap itself.
- The signal line — a nine-period EMA of the MACD line, which smooths it and lags it slightly.
- The histogram — the MACD line minus the signal line, drawn as bars above and below zero.
- The zero line — not a calculation, just the level where the two EMAs are equal.
Each element answers a different question, and confusing them is the most common beginner mistake.
How the MACD line is calculated
An exponential moving average weights recent closes more heavily than old ones, which is why MACD uses EMAs rather than simple averages — it reacts to a change in pace instead of waiting for old data to fall out of the window. If moving averages are new to you, our guide to the five main indicators used in technical analysis sets them in context.
MACD line = 12-period EMA - 26-period EMA
Period means whatever your chart is set to: twelve one-minute candles, twelve four-hour candles, twelve days. Nothing in the formula is daily-specific.
When the MACD line reads +180 on a chart priced in dollars, the fast average is $180 above the slow one. The number itself is scale-dependent, which is why MACD values are never compared across assets — only against their own recent range.
How the signal line works
Signal line = 9-period EMA of the MACD line
The signal line is an average of an average. It exists to give the MACD line something to cross. On its own it says nothing; its only job is to lag the MACD line by a predictable amount so that a change of direction becomes a discrete, plottable event.
That is also its weakness. A crossover is a mathematical certainty every time momentum wobbles, whether or not the wobble means anything.
What the MACD histogram shows
Histogram = MACD line - signal line
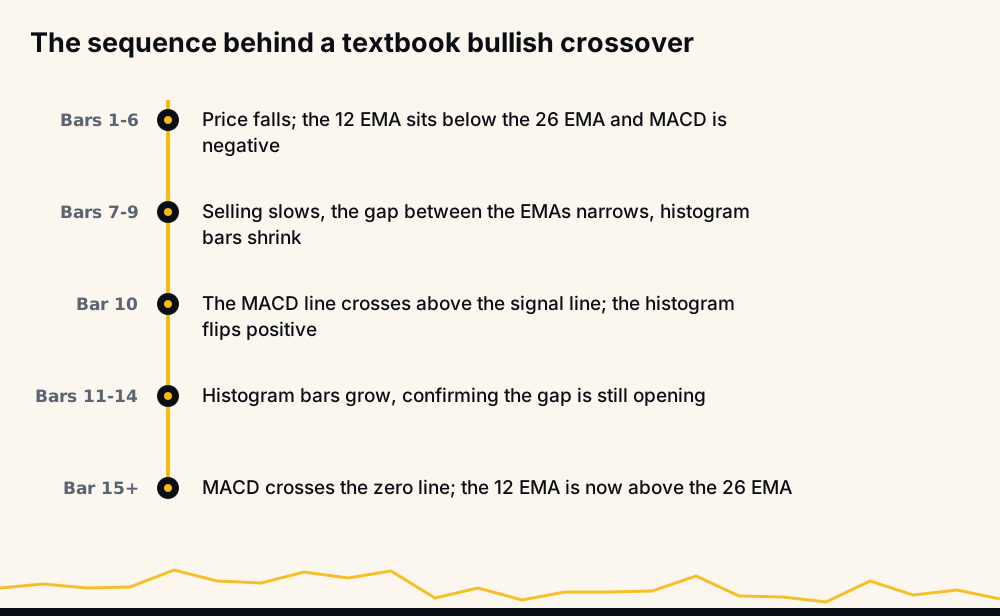
The histogram is the earliest of the three reads. Bars stop growing before the lines cross, so a shrinking histogram tells you the momentum gap is closing while the crossover is still two or three bars away.
Two things it is not: the bars have nothing to do with trading volume, and a green histogram does not mean price is rising. It means the MACD line is above its own signal line, which can happen while price is still falling.
Zero-line crossovers: which average is on top
When the MACD line crosses above zero, the 12-period EMA has moved above the 26-period EMA. Below zero, the slower average is on top. This is the coarsest read MACD offers and also the most stable one — it changes rarely, and it changes late.
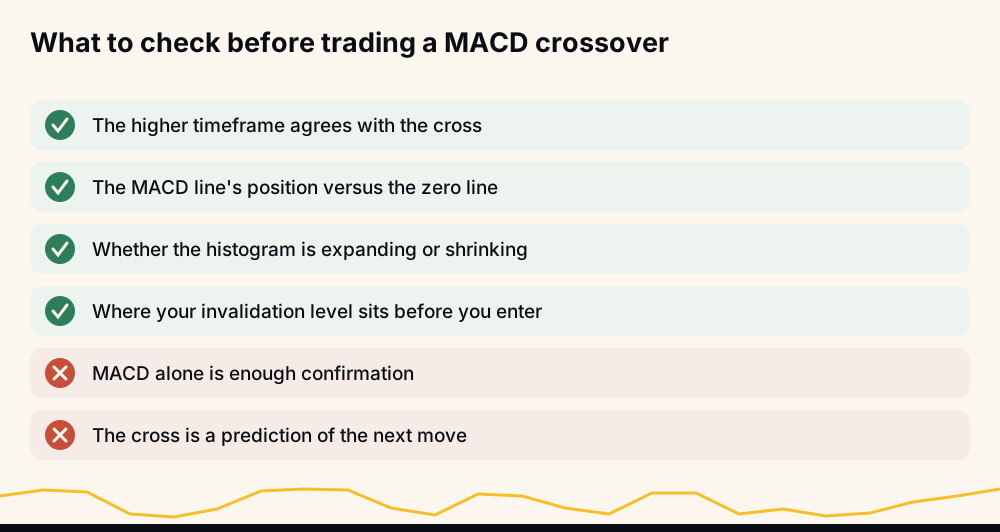
Most traders use the zero line as context rather than as a trigger: a bullish crossover that happens below zero is a counter-trend bet, while the same crossover above zero is going with what the averages already agree on.
Signal-line crossovers: the classic buy and sell reading
The textbook reading is straightforward. The MACD line crossing above the signal line is treated as a potential long entry; crossing below it as an exit or a short. Almost every "MACD strategy" you will find is some filter bolted onto that one event.
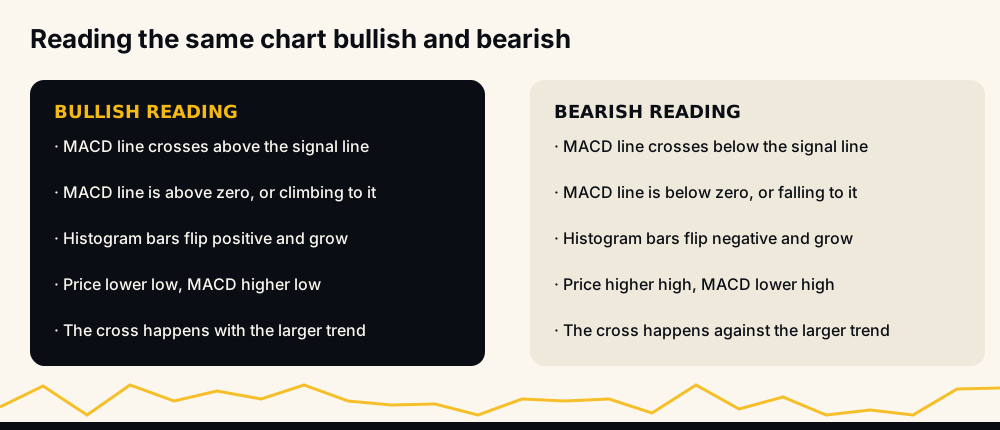
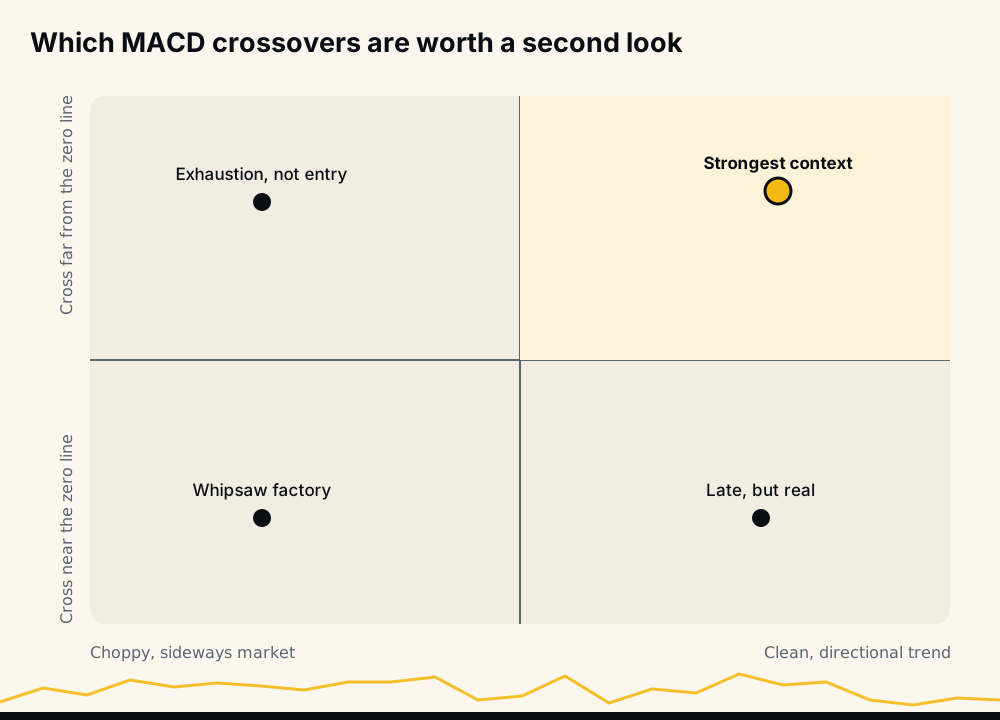
What separates a useful crossover from a coin flip is where it happens. The same cross means different things at the extremes of the panel than it does hugging the zero line, and it means something different again in a range than in a trend.
MACD divergence, and why traders get it wrong
Divergence is a disagreement between price and the indicator. Price makes a higher high, MACD makes a lower high: the second push had less momentum behind it than the first. That is bearish divergence. The mirror case — price making a lower low while MACD makes a higher low — is bullish divergence.
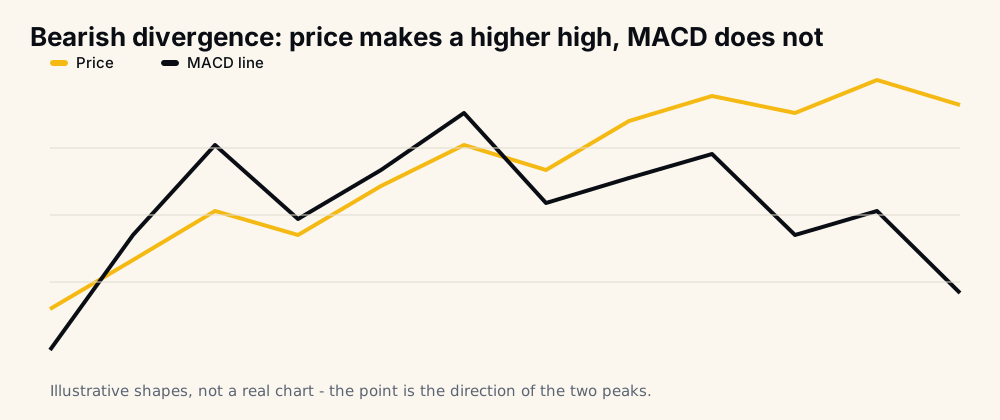
The trap is that divergence describes deceleration, not reversal. A trend can decelerate and then accelerate again, printing three "failed" divergences on the way up. Divergence is a reason to tighten risk or wait for a structural break — a lost support level, a failed retest — not a reason to fade a trend on its own. The levels that turn a divergence into something actionable come from chart structure, which is where the foundations of technical analysis do more work than any oscillator.
MACD settings: 12, 26, 9, and when to change them
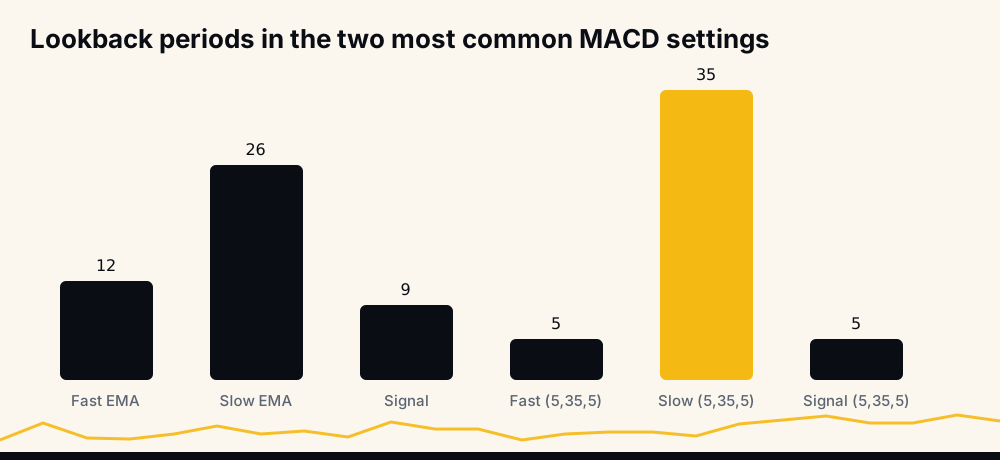
The 12/26/9 default has no magic in it; Appel picked periods that suited the daily charts of his era. Two facts are worth more than any settings debate:
- Faster settings produce more crossovers, not better ones. Dropping to 5/13/5 roughly doubles your signal count and roughly doubles your false ones.
- Slower settings (5/35/5 is a common weekly variant) trade responsiveness for reliability. You will miss the first third of most moves.
In crypto specifically, sensitivity is expensive. A market that can move six percent in an hour will generate crossovers on a fast MACD all day long. If you change anything, change the timeframe you look at, not the periods.
Is MACD a leading or a lagging indicator?
Lagging — with one caveat. The MACD line and signal line are both averages of past prices, so they confirm what has already happened. The histogram is the closest MACD gets to leading, because it turns before the lines cross, but it is still derived entirely from closed candles.
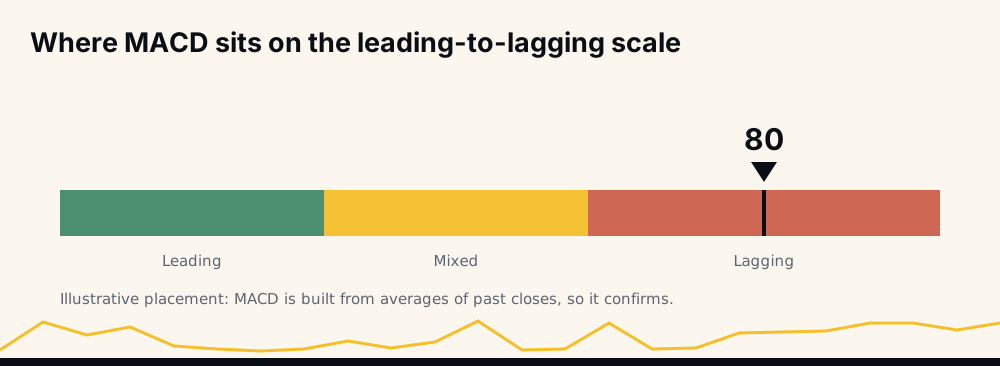
A related question that comes up constantly: does MACD repaint? No. Values on closed candles are fixed forever. The current, unclosed candle updates as price moves — that is live data, not repainting, and it is why acting mid-candle on a cross that has not confirmed produces so many phantom entries.
Where MACD fails: ranges, whipsaws and false signals
MACD is a trend-following tool. In a sideways market there is no trend for it to follow, so the two lines braid around each other and around zero, firing crossovers in both directions within hours.
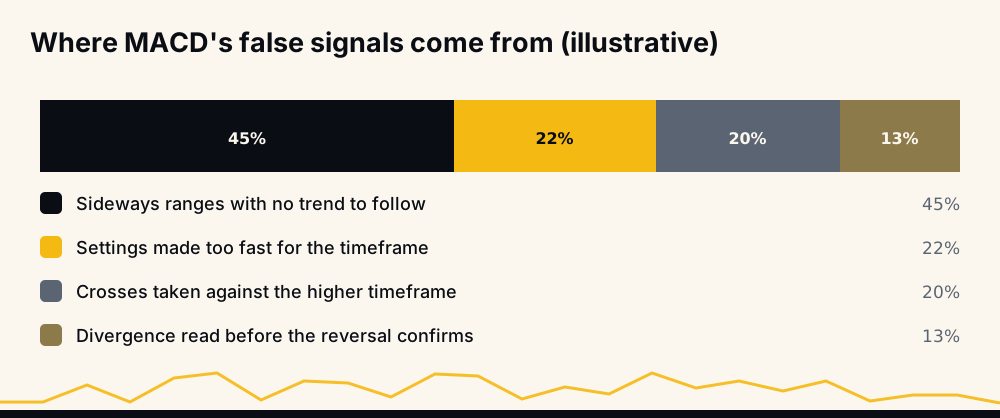
The practical filter is context, not a better setting. A crossover deep in a directional move, far from the zero line, is describing a real change of pace. The identical crossover in a quiet range is describing noise.
Three further failure modes worth knowing: MACD says nothing about volatility, so it cannot size a stop for you; it says nothing about volume, so a crossover on thin liquidity looks identical to one on real participation; and it is symmetric, so it treats a slow grind up and a violent flush down as the same kind of event.
How to combine MACD with other indicators
The standard pairing is a momentum oscillator, usually RSI, because it answers a question MACD cannot: whether the move is stretched. MACD tells you the direction of momentum; RSI tells you how far it has already run.
Structure beats indicators for confirmation, though. A crossover that coincides with a break of a level, or with a reversal candle at that level, is worth more than a crossover that agrees with a second lagging indicator built from the same closes. The twelve frequently used candlestick patterns in technical analysis are a better second opinion than another average, and the common mistakes in technical analysis piece covers the stacking problem directly.
Reading MACD on crypto charts specifically
Crypto never closes, so "the daily close" is an arbitrary UTC boundary rather than a settlement event. That matters more than traders expect: a daily MACD on a market with no session breaks is measuring a slightly different thing than a daily MACD on equities.
Perpetual futures add a second wrinkle. Funding, liquidation cascades and thin weekend books produce candles whose momentum has nothing to do with directional conviction, and MACD will happily average them in. If you trade perpetuals, the funding schedule and the depth of the book on a Sunday night matter as much as anything in the indicator panel, and the practical habits in tips for cryptocurrency trading apply before any indicator does.
Where MACD lives on a charting platform
On TradingView, Binance, MT4/MT5 and every broker terminal, MACD is under indicators, usually as "MACD" or "Moving Average Convergence Divergence", with the three period inputs exposed in the settings dialog. Colour conventions differ — some platforms draw the histogram in one colour, others switch colour when bars flip — which is why screenshots from two platforms of the same chart can look unrelated.
Watching crossovers without watching the screen
Nobody can scan five hundred pairs for crossovers by eye. Chart screeners exist for exactly that reason: they list the pairs whose MACD has just crossed, so a scan that would take an hour takes a glance. A screener is worth being precise about — it reports a chart event, and a chart event is not a trade.
None of this is investment advice, and no indicator changes that. MACD is a lens on momentum, not a forecast; trade only what you can afford to lose, and size positions so that the crossovers that fail — and a fair share will — cost you an amount you had already accepted.
About HafizeBot
HafizeBot's signals come from a model that evaluates 240+ indicators, formulas and components; we do not publish which. How HafizeBot's signals are structured and published explains what each call contains. The published record runs to 33 monthly spreadsheet reports covering June 2021 to February 2024 and 33,694 signals, with median monthly accuracy of 98.9% as reported in those sheets — the files are on the reports page. Since June 2026 the performance page has been regenerated hourly straight from the trade database, where a target hit counts as a win and the page shows Wins, Missed and Open. Broadcast signals carry a target and a maximum hold, not a stop, so every signal that does not reach its target in time counts as Missed and lowers the rate.
Frequently asked questions
What does the MACD indicator tell you? It tells you the size and direction of the gap between a 12-period and a 26-period exponential moving average, and whether that gap is widening or narrowing. Widening means momentum is building in the direction of the trend; narrowing means it is fading. It says nothing about how far price will travel.
Is MACD a leading or lagging indicator? Lagging. Both lines are built from averages of closed prices, so they confirm moves rather than predict them. The histogram turns earlier than the crossover does, which is the closest MACD gets to an early read.
What are the best MACD settings? 12, 26 and 9 remain the default on every platform, and there is no evidence that any other combination is universally better. Faster settings produce more signals and more false ones; slower settings such as 5/35/5 are steadier on weekly charts. Change your timeframe before you change the periods.
Does the MACD indicator repaint? No. Values on closed candles never change. The bar in progress updates with live price, which is why a crossover can appear mid-candle and vanish before the candle closes — a good reason to wait for the close before acting.
How accurate is MACD on its own? There is no fixed accuracy rate, and anyone quoting one is quoting a single backtest on a single market. Its hit rate depends almost entirely on regime: it performs when a market trends and produces repeated whipsaws when it ranges.
Can MACD be used for crypto day trading? Yes, and it is widely used, but intraday crypto is exactly where the false-signal problem is worst. Most traders who use it successfully on short timeframes take crossovers only in the direction of a higher timeframe trend, and ignore the rest.
Where to go from here
If you are building a chart-reading routine, add MACD as one input among several rather than as a system, and test it on your own charts before you take anyone's call, including ours. If you would rather see how a signal service reports its own losses, the hourly performance page counts expirations against itself and the monthly spreadsheets are downloadable in full.