How to Use the RSI (Relative Strength Index) Indicator to Trade
- nurgulguler308
- Oct 21, 2021
- 4 min read
What is your favorite momentum oscillator? A difficult question, to be sure, but there is one that has been a favorite of most day and swing traders since it was originally established by J. Welles Wilder Jr. in 1978: the Relative Strength Indicator (RSI). The Relative Strength Indicator is one of the easier indicators to use, but trading it may take a bit more understanding beyond the oversold/overbought signals that appear on the charts, which we shall discuss in this blog article.
What is the RSI (Relative Strength Indicator)?
The Relative Strength Indicator is a momentum oscillator that measures price action's speed and direction. The RSI oscillates between 0 and 100, with any price below 30 suggesting a "oversold" condition and any price above 70 indicating a "overbought" one. Simply put, if an asset is trading above its "true" price, it is called overbought; if it is trading below its "true" price, it is deemed oversold. Intuitively, it appears to be a case of "overpriced and underpriced" circumstances. This is comparable to a company's market capitalization as defined by 52-week highs and lows, but the RSI follows stock price fluctuations over shorter time frames/periods.
The RSI is comprised of three simple components:

1. Vertical Percentage Rage: This metric shows oversold/bought circumstances within a percentage range of 0 to 100%.
2. The RSI Line gauges the pace and direction of price movement from oversold to overbought levels.
3. Center Line: This line splits the percentage range, with bullish situations written above the line and bearish conditions printed below, with the line resting at the 50% level.
When prices are increasing, the Relative Strength Indicator (RSI) tends to stay around the 40~90 range, with the centerline indicating an RSI support level. In a bear market, the RSI will be between 10~60, with the centerline acting as resistance. These ranges will change somewhat based on the parameters of the RSI Indicator and market momentum.
Over a 14-day period, the RSI line indicates an average of the number of days the price was up divided by the number of days it was down. For down days, the inverse is calculated. The 14-day period is a reference to the standard RSI setting and may be modified for more or lesser sensitivity based on the time frame being traded. Smoothing is the process of lengthening the period duration, which provides stability to the RSI price line. As a result, while trading smaller time frames, some traders choose to use a longer period to decrease volatile swings in the RSI and produce a "smoother" oscillation line.
Trading the RSI (Relative Strength Indicator)
Divergence is the most often traded technique for stocks and other assets on the RSI Indicator. RSI Divergence occurs when the price of a stock contradicts the RSI indicator, indicating a probable price trend reversal. The Relative Strength Indicator is a vital addition to any trader's armory since it may detect trend reversals before they occur.
Bullish (Positive) Divergence: Bullish (Positive) Divergence (as seen below) occurs when the RSI prints higher lows from an oversold position above the 30% range and price follows with lower lows on the chart. This is an indication that the selling momentum is slowing and that a long entry is possible.

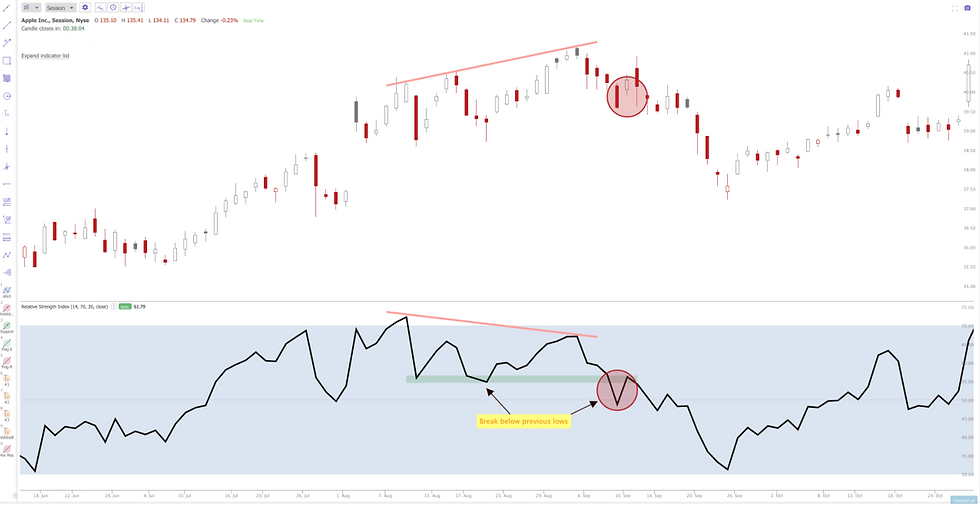
Bearish (Negative) Divergence: Bearish (Negative) Divergence (as seen below) occurs when the RSI prints a lower high from the overbought position below the 70% line, while the price continues to make higher highs. This indicates that purchasing is slowing and points to a possible short entry.

RSI Swing Rejections
RSI Swing Rejections disregard price activity and instead look only at the RSI's oscillation for entities and exits on a position, which might be difficult for some traders to accept. This approach is similar to support and resistance rejections, but it employs the RSI oversold (30%) and overbought (70%) regions. Potential trade entries are initiated under certain situations.
A Bullish Swing Rejection occurs when the RSI line gains the 30% level from an oversold situation, pulls back to test the 30% level as support, then bounces off the 30% level to create a higher low than the previous high achieved after breaking out of the range. A possible long (buy) transaction is initiated under these situations.

A Bearish Swing Rejection (as seen below) occurs when the RSI line falls below the 70% (overbought) level, resulting in a new swing low. Price attempts to reclaim the 70% level, but is rejected at the swing low formed by the collapse, resulting in the continuation of the negative trend. A possible short (sell) transaction is initiated under these conditions.
Because the RSI (like many others) is a lagging indicator, it is advisable to trade any of these stock trading methods in accordance with the current macrotrend. As a result, we do not recommend placing a trade on a bearish swing rejection during an uptrend, and vice versa. Keep in mind that "the trend is ALWAYS your friend."
Furthermore, an asset might remain in the oversold / overbought territory for an extended period of time, resulting in false positives / negatives that can wear down an account. As a result, we strongly advise using the Relative Strength Indicator in conjunction with other indicators and candlestick chart patterns to validate the trade before pulling the trigger.
In conclusion
The "can't be bought from the top and sold at the bottom" approach is a misunderstood issue in the cryptocurrency market. The Rsi indicator helps you to trade from the best place. Working with artificial intelligence, Hafizebot works by taking into account the Rsi indicator. At this point, Hafizebot, which offers you the opportunity to autotrade, provides the fastest trading. It works integrated with your Binance Global account.


Comments