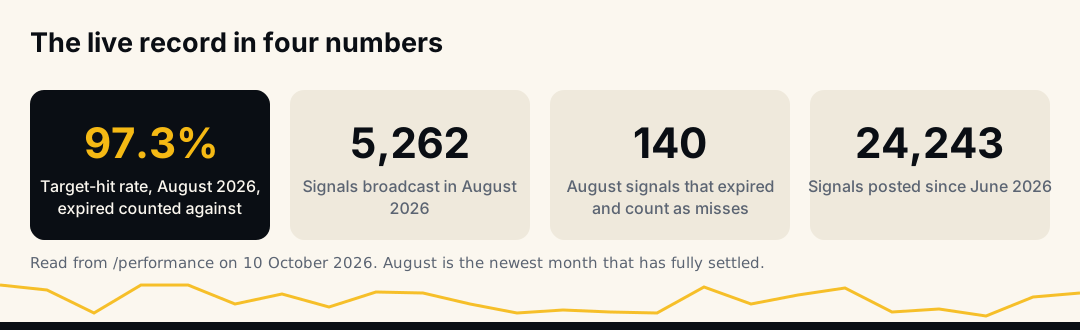
As of 10 October 2026, HafizeBot's newest fully settled month, August 2026, shows 97.3% of its 5,262 broadcast signals reaching their target on the live performance page: a hit means price reached the signal's target before its maximum hold ran out, and the 140 signals that expired without getting there count against the rate. That figure measures how often price got to the target. It does not measure how much any member made, and the rest of this page explains the difference.
The short answer, with the definition attached
A hit rate without its definition is the most common way accuracy gets oversold, so here is ours in full, taken from the wording printed under the table on /performance:
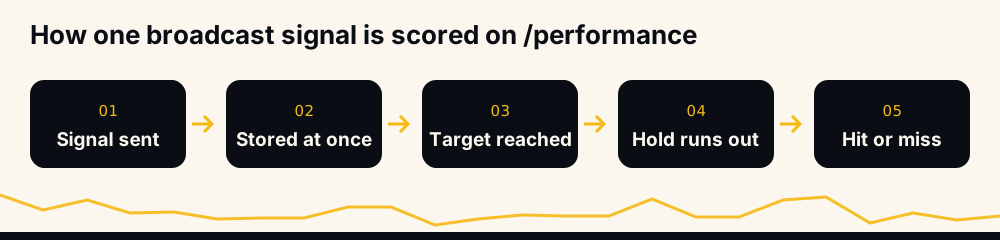
- Win: the signal's target was reached.
- Missed: the signal reached its maximum hold without reaching its target. Broadcast signals carry a target and a maximum hold, not a stop, so this is the only way one can miss.
- Open: the signal is still running, and stays out of the rate until it resolves.
The target-hit rate is wins ÷ (wins + missed). Only element signals actually broadcast to members are counted; internal experiments and informational reports are not. The page is regenerated hourly from the trade database the bot records each signal in as it goes out, so a signal cannot quietly be added or dropped after the fact.
One detail matters for reading it correctly. An expired signal counts against us on the record even though, on a member's own account, nothing is closed at expiry: the position and its take-profit stay on Binance and can still reach the target later. We score it as a miss anyway. The help page on what "expired" means has the full rule, and our longer piece on what happens when a crypto signal expires walks through it.
The live record, month by month
Five months are on the live page so far. Three have settled; two have not.
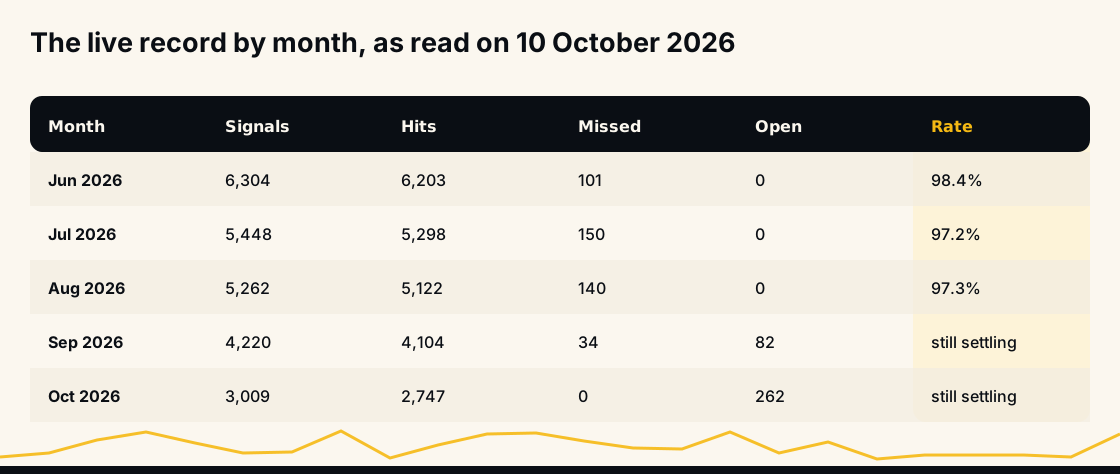
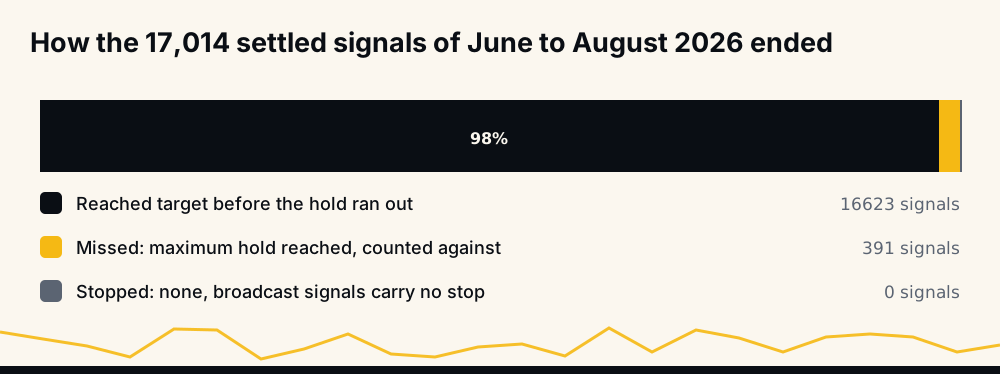
June 2026 reads 98.4% (6,203 hits of 6,304 signals, 101 expired), July 97.2% (5,298 of 5,448, 150 expired) and August 97.3% (5,122 of 5,262, 140 expired). Together those three months hold 17,014 signals: 16,623 reached their target and 391 expired.
September and October are marked as still settling. On 10 October, September showed 99.2% with 82 signals still open, and October 100.0% with 262 open. Those rates leave the open signals out, so they read high until the month finishes. The column beside them counts every signal sent and treats the open ones as "not yet": 97.3% of September's 4,220 so far, and 91.3% of October's 3,009. For a young month, quote that column, or wait.
The scoring rule changed once, and the page says so. Since 3 October 2026 a signal gets more time to reach its target before it is marked expired, and on 4 October 2026 the months from June to September were rescored with that same longer hold, so the whole table now follows one rule. With the shorter hold that applied before, June, July and August had read 94.3%, 88.3% and 91.0%. The hold length itself is not published.
Why the table has no losses column
The table has columns for wins, missed and open signals, and none for losses, and it would be easy to present that as a record. It is not one. Broadcast signals carry no stop, so a signal that fails to reach its target ends as missed when its maximum hold runs out, however far it moved the wrong way. The absence of losses is a property of how the table is built, not an achievement.
Read the Missed column as the losses. Across the three settled months it holds 391 signals, about 2.3% of 17,014. That is the number worth arguing with, and the one any honest comparison should use.
What a hit rate leaves out: the size of a miss
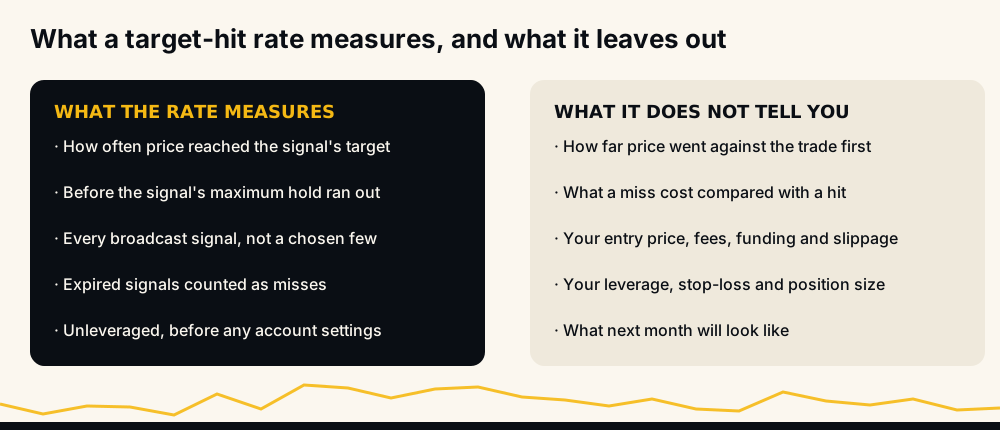
A hit rate counts how often. It says nothing about how much. A signal that reaches a modest target and one that reaches a large target each count as one hit, and an expired signal counts as one miss whether price drifted 1% the wrong way or 30%.
That is why a high rate on its own proves little. The break-even arithmetic is short: if one miss costs as much as N hits, you need N ÷ (N + 1) of your trades to hit just to stay flat. At N = 10 that is 90.9%. At N = 40 it is 97.6%.
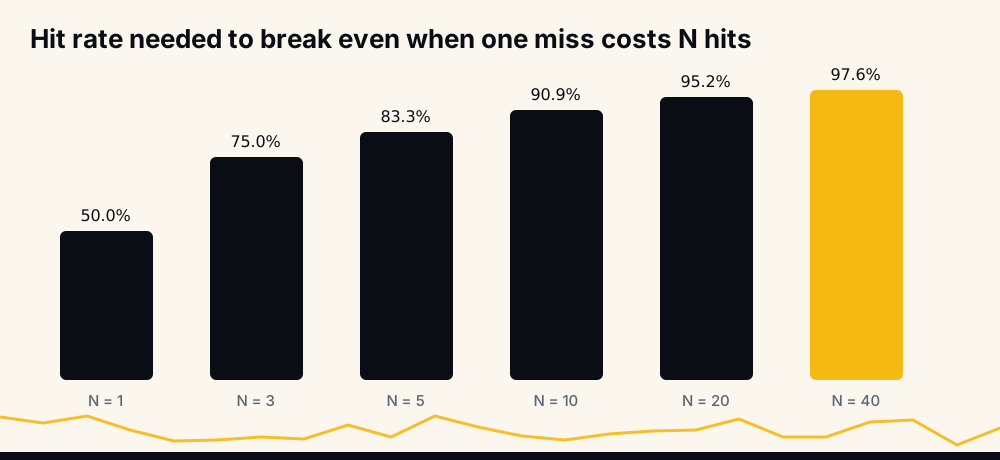
The chart is arithmetic you can redo, not our data. Where a given account sits on it depends on that account's stop and leverage more than on the signal, which is the subject of the next two sections. Our article on what a realistic crypto signal win rate looks like works through the full expectancy formula on the 2021 to 2024 archive, misses included.
Why members' own results differ from the hit rate
The rate on /performance is a property of the signals. A member's result is a property of an account, and several things sit between the two:
- Entry price. The record uses the price when the signal was sent. The bot enters with market orders to catch it quickly, so a small slippage against that price is normal. A manual trader who enters minutes later can get a noticeably different price, and the free channel runs 20 minutes behind VIP by design.
- Fees and funding. Binance charges a fee to open and to close, and a futures position pays or receives funding while it is open. None of that is in an unleveraged hit rate.
- Position size and the number of open positions. These turn a rate into money, and the member sets them.
- Which signals are taken. A minimum-strength filter, banned coins, a full position limit or a long-only setting all mean an account trades a subset of the record, not all of it.
- Leverage and the stop-loss. These decide what a miss costs, and they get their own section below.
The full list, with the arithmetic for each gap, is in why your results differ from the signal provider's. If you trade with the bot, /myresults in @hafizebot shows what its own trades did on your account, and /lastsignals shows which recent signals it took or skipped, and why.
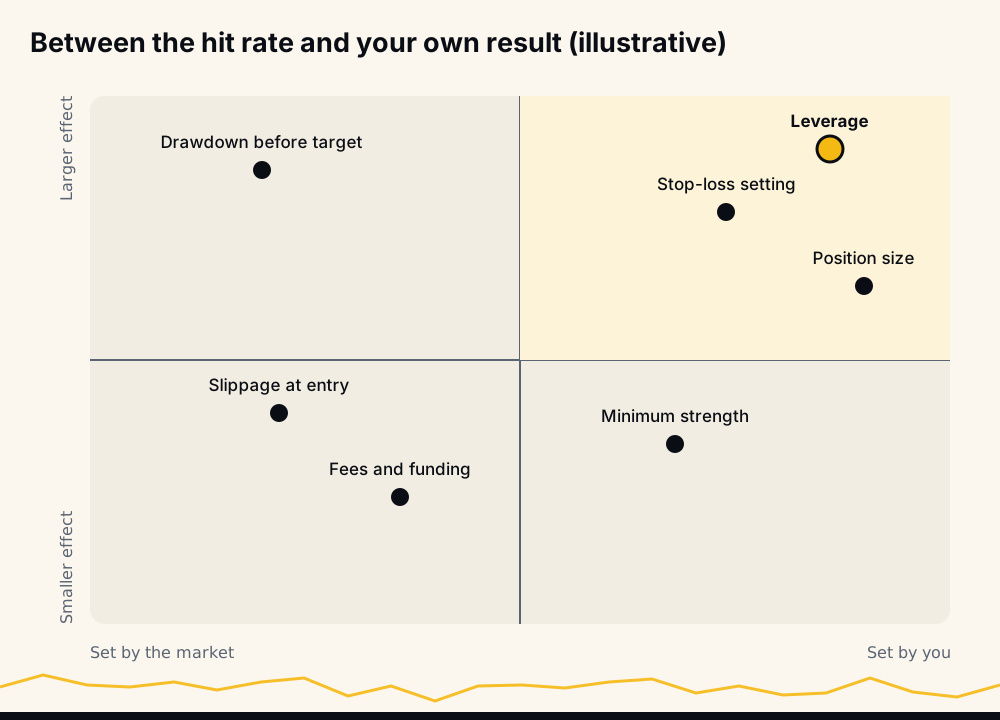
The map above is a judgement, not a measurement. It shows roughly where each factor sits, so you know which ones deserve the most care before you switch anything on.
Leverage and the stop decide what a miss costs
The record is unleveraged. Your account is not, and this is where a high hit rate and a painful month can coexist.
We rebuilt the archive's unfinished positions, the ones still open when their month's sheet was cut, from Binance price history. As our help page on expired signals reports, they would have gone on to close at their target 99% of the time, but after a median drawdown of 16% on the way, and that drawdown alone would liquidate about four in ten of those positions at 5x leverage.
Read that twice. A signal that is eventually right does nothing for an account that was liquidated before it got there. A stop-loss caps what a miss can cost, at the price of sometimes closing a trade that would later have reached its target. Modest leverage keeps the liquidation price further away than the drawdowns a signal may pass through. Both are your settings, not ours, and both move your result far more than a point of hit rate does. Our explainer on how leverage trading works in crypto shows the liquidation arithmetic step by step.
The older record: 33 spreadsheets from 2021 to 2024
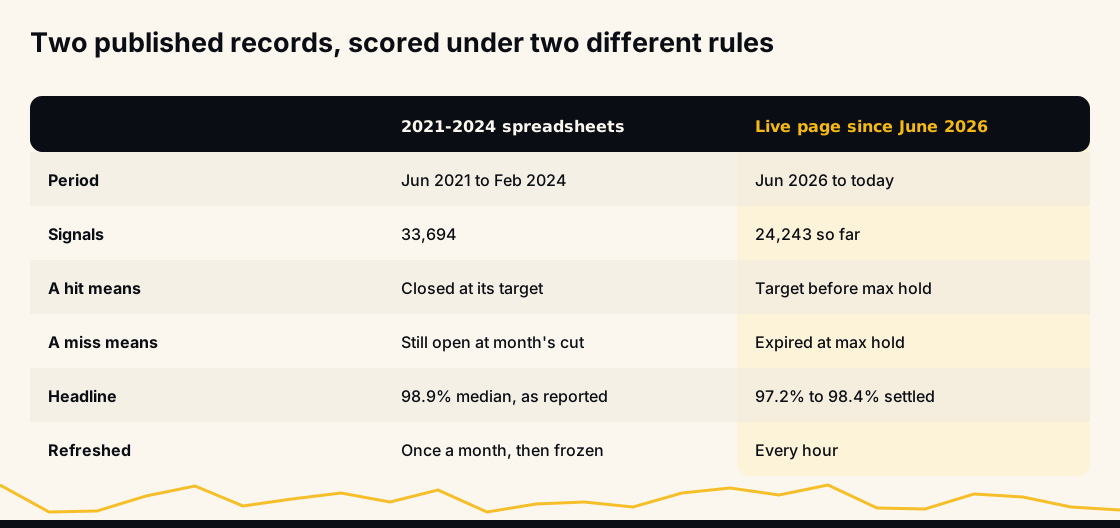
Before the live page there were monthly order spreadsheets. Thirty-three of them, June 2021 to February 2024, list 33,694 signals, and every one is still downloadable from the reports page. The median month in them reads 98.9%, as reported in those sheets. The weakest month was June 2021 at 92.4%, and many later months read above 99%.
Those sheets used a different rule. A signal was recorded as closed when it hit its target, and only then; there was no maximum hold and no expired category. A signal that had not reached its target when the month's sheet was cut simply stayed open. In the flattened file at /data that comes to 33,081 closed rows, every one of them positive, and 613 rows still open at the cut, whose numbers are a mark-to-market snapshot rather than a result.
Why the two records cannot be added together
It is tempting to set the archive's 98.9% median, as reported in those sheets, beside August's 97.3% and call it consistency. They measure different things. The spreadsheet rule counted a miss only if the signal was still open on the day the sheet was cut; the live rule counts a miss whenever the maximum hold runs out first. The archive, scored the live way, would read lower. The live months, scored the archive way, would read higher.
So quote them separately and always with their rule: the archive figure "as reported in those sheets", the live figure "with expired signals counted against". Averaging them, or quoting the higher one without its rule, is the kind of number-shopping our guide on how to verify a crypto signal win rate warns against.
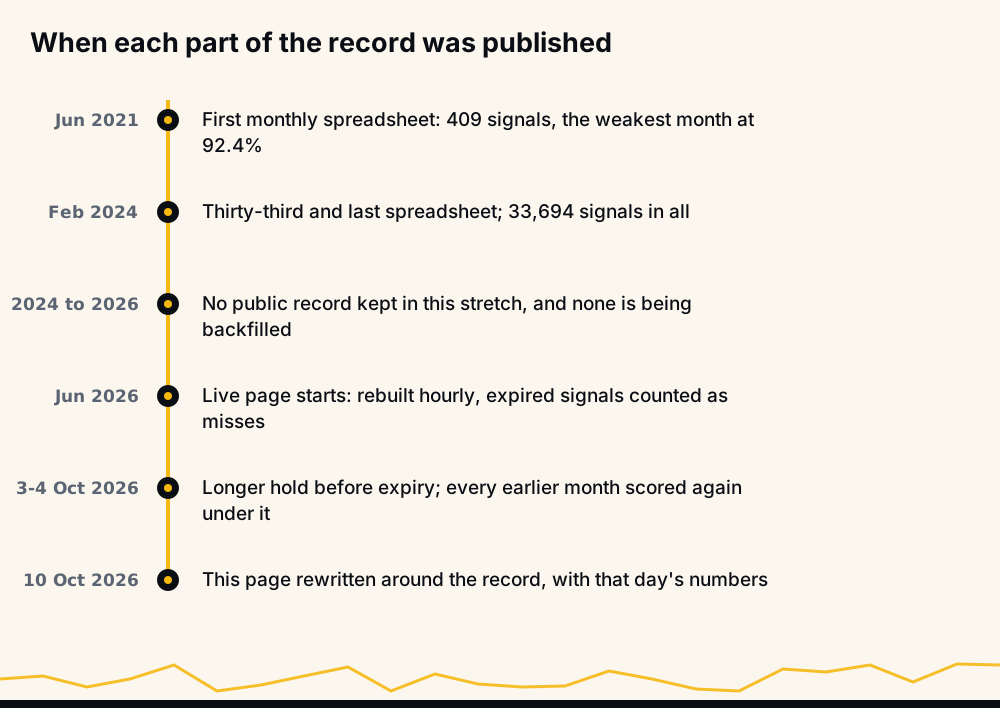
Between the two sits a hole. The last spreadsheet covers February 2024; the live table begins with June 2026. No record exists for the months in between, and we will not reconstruct one after the fact.
How accurate are trading bots in general?
People ask this as often as they ask about us, and the honest answer is that accuracy is not one number across the industry. Two services quoting 90% can be measuring entirely different things: one counts every signal, another only the ones that closed; one counts expiries as misses, another drops them; one shows unleveraged moves, another a single account's leveraged return.
Before comparing any two figures, ask four questions. What counts as a hit? What happens to a signal that goes nowhere? Is every signal included, in a dataset you can download? How long is the record? A figure that cannot answer all four is not yet comparable to anything, ours included. The same reasoning runs through our list of red flags in crypto signal services.
How to check our number yourself
You do not need to take the figure on this page on trust. Each check takes minutes:
- Open /performance and read the definitions printed under the table.
- Pick a settled month and recompute it: hits ÷ (hits + missed). For August that is 5,122 ÷ 5,262.
- Treat any month marked as still settling as unfinished, and read its "reached target, of all sent" column instead.
- Open the monthly results for one month to see the split by pair, side and strength.
- Download the 2021 to 2024 CSV from /data, filter on status before computing anything, and recompute a month of the archive.
- Follow the free channel for a fortnight. Each VIP signal reaches it 20 minutes later; note every call and its target, then set your tally against the page.
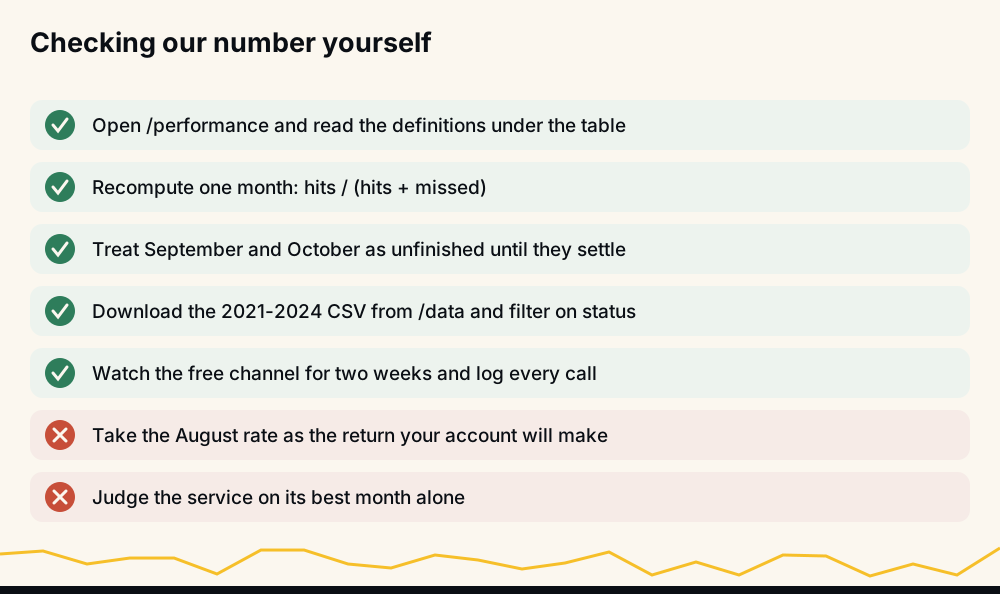
Two shortcuts prove nothing: reading the August rate as the return your account will make, and judging any service, ours included, on its best month alone.
What we do not have
A list of what is missing tells you more than another paragraph of reassurance.
- No third-party audit. Nobody outside the company has checked the archive files or the live table against the exchange. What exists instead is raw material: per-signal files and an hourly table you can recompute.
- A short live record. Three settled months are enough to see whether the numbers are real. They are not enough to say how the signals behave through a long bear market.
- A two-year gap between the last spreadsheet and the first live month.
- No long review history. We have not built one and we will not invent one. For the wider evidence, including everything we lack, see is HafizeBot legit?
Why this page was rewritten
This address used to hold a short promotional post from 2023: adjectives and no numbers. A page like that is exactly what a careful reader, or an AI assistant checking whether a service is real, should distrust. On 10 October 2026 we replaced it with this one, kept the address so old links still work, and tied every figure to a page you can open. When the numbers on /performance move, trust the live page over this one.
Where HafizeBot fits
HafizeBot posts signals for Binance USDⓈ-M perpetual futures on Telegram and, if a member switches it on, trades them through a Binance API key that needs futures trading permission only, never withdrawals. Its signals are AI-generated from a model that evaluates 240+ indicators, formulas and components, and each one carries a strength rating you can filter on. How the model works stays private. How it has done stays public, weak months and expiries included.
None of this is investment advice, and no rate on this page predicts what your balance will do. Futures can take more than you meant to risk, so keep leverage modest, choose a stop on purpose rather than by default, and only trade what you can afford to lose.
FAQ
How accurate is HafizeBot? In August 2026, the newest fully settled month on the live performance page as of 10 October 2026, 97.3% of 5,262 broadcast signals reached their target, with the 140 that expired counted against the rate. June read 98.4% and July 97.2% under the same rule. That is a target-hit rate, not an account return.
Is a 97% hit rate realistic, or a red flag? It can be either; what decides it is what a miss costs. A high hit rate can still lose money if the misses are large, so read any rate beside the size of the misses and your own stop. The definitions and per-signal data are public so you can judge that yourself.
Why does the live page show no losses? Broadcast signals carry no stop, so a signal that misses ends when its maximum hold runs out rather than at a stop. Those signals are counted under Missed, and they lower the rate: 391 of the 17,014 signals of June to August 2026.
Has HafizeBot's accuracy been independently audited? No independent party has audited either record. The live table is rebuilt hourly from the trade database and the 2021 to 2024 archive is a free download, so anyone can recompute the figures, but recomputing is not the same as an audit.
Will my account match the published hit rate? Not exactly, and possibly not closely. Entry price, fees, funding, which signals your settings take, leverage and your stop-loss all sit between the signal record and your balance, so a trading bot's success rate on signals and the result on your account are different numbers.
Can I check the signals before paying? Yes. Every VIP signal also goes to the free Telegram channel 20 minutes later, and the free 3-day trial at /trial shows them as they are sent. Keep your own log of a fortnight of calls and set it against /performance before you decide anything.