Some are, for some followers — but a signal group's published win rate is never your return, and the gap between the two is where the real answer lives. A channel records the call; you record a fill twenty minutes later, at a different price, in a size you chose, minus fees, on the subset of calls you actually took. Those four differences routinely turn a genuinely positive channel into a negative account.
So the useful question is not "is this group profitable" but "what would my result have been, taking every call at a fixed size, after costs". This article shows how to compute that, and what has to be true of the group before the exercise is worth doing at all.
What "profitable" has to mean before it can be answered
Three definitions get used interchangeably and they are not the same thing:
- The channel's accuracy — how often its calls hit target before stop. This is a property of the signals.
- The channel's theoretical return — what a follower who took every call at a fixed size would have made, gross.
- Your return — what actually happened in your account, after fees, at the fills you got, on the calls you took.
Most marketing quotes the first and lets you infer the third. They can differ enormously, and the direction of the error is not random: it is almost always in the channel's favour, because every step between the post and your account subtracts something.
Where a follower's result diverges from the channel's
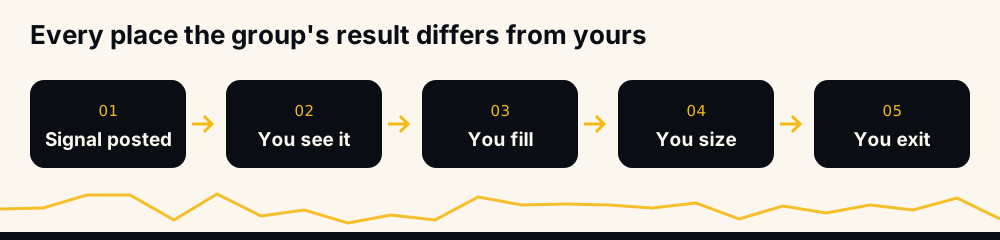
Each of those steps is a leak. Ranked by how much they typically cost:
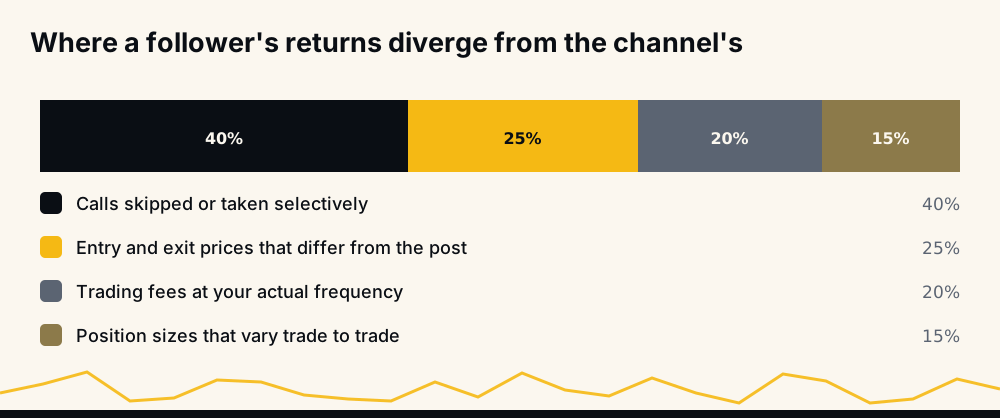
Leak 1: the calls you did not take
This is the largest one and the least discussed.
A channel's record assumes every call was taken. You took the ones you saw, at hours you were awake, that you liked the look of. That is not the same portfolio — it is a portfolio your intuition selected from theirs, and its performance tells you about your intuition rather than about them.
The selection is rarely random either. Most people skip the calls that feel uncomfortable, which tend to be the counter-trend ones, which in many systems are where a meaningful part of the edge sits. Skipping them systematically removes a specific slice of the distribution rather than a random sample of it.
Leak 2: the price you actually got
A signal states an entry. You get a fill.
Between the two sits the delay before you saw the message, the time to place the order, and the spread. On a free tier with a stated delay the gap is larger; even on an instant tier it is not zero. Sometimes it favours you. On average it does not, because the moves that run away from the entry fastest are exactly the ones you most wanted to be in.
The consequence is not just a slightly worse entry — it changes the trade's shape. Your stop is now further away in percentage terms, or your target is closer, so the reward-to-risk you are actually trading is worse than the one the signal described. Reading a signal line by line covers how those levels interact; the point for profitability is that a worse entry degrades the ratio, and the ratio is what decides the win rate you need.
Leak 3: fees at your trade frequency
Fees are charged per trade on notional value, so they scale with how often you trade and how large your positions are — not with your profit.
The arithmetic is unforgiving on high-frequency following. A round trip costs you the taker fee twice, plus spread. If a channel produces several calls a day and you take them all, the annual fee bill on a leveraged notional can be a substantial fraction of the account. Any comparison of your result against the channel's must subtract this, because the channel almost certainly did not.
Why the win rate you need is lower than people assume
Before deciding whether a channel's accuracy is "good", work out what accuracy would be needed to break even at its reward-to-risk ratio.
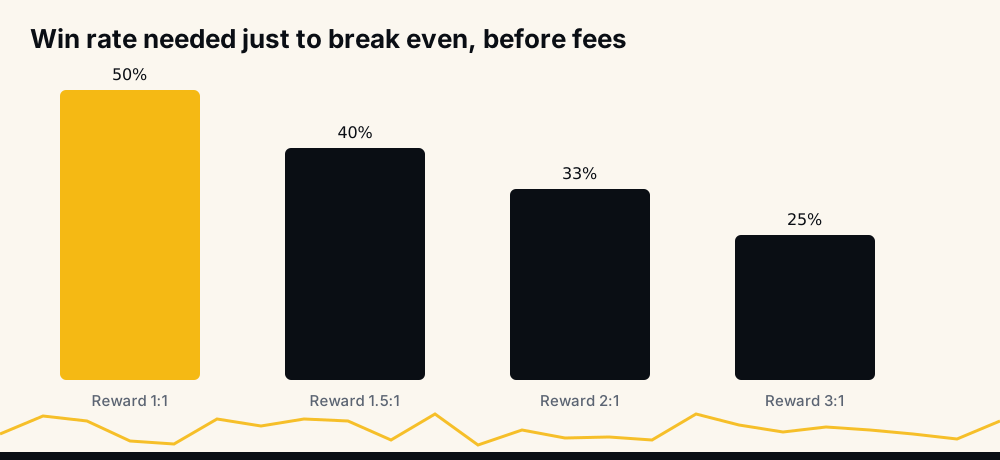
At a 2:1 reward-to-risk, a system needs only about 33% of trades to win before it stops losing money. At 1:1 it needs more than half. This is why a channel advertising 90% accuracy is not automatically better than one advertising 55% — if the 90% one takes tiny profits and lets losses run to a distant stop, its expectancy can be negative while the 55% one's is positive.
Accuracy without the reward-to-risk ratio is an incomplete number. Ask for both, or compute the ratio yourself from the entry, target and stop in the posted signals.
Position sizing decides more than the signals do
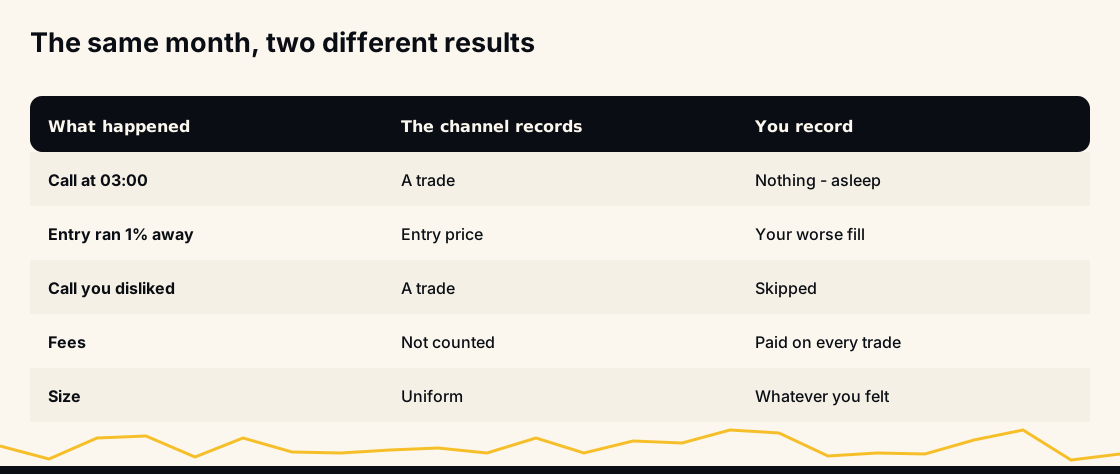
Two people can follow the same channel, take the same calls, and end the month in opposite directions purely on sizing.
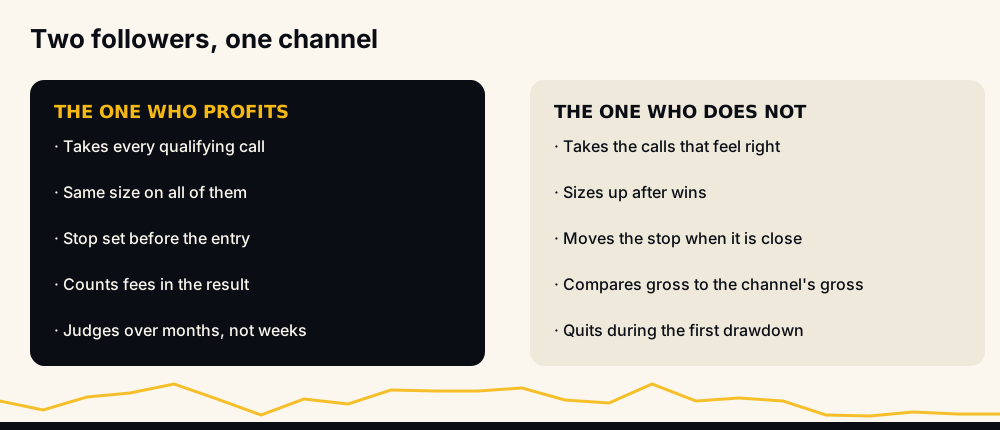
The right-hand column is not a description of reckless people. It is a description of ordinary ones, because every item on it is what feels sensible at the time. Sizing up after wins feels like pressing an advantage. Moving a stop feels like giving a trade room. Both convert a system with positive expectancy into one where a single bad sequence costs more than several good ones earned — which is the same argument for setting the stop before you enter rather than deciding in the moment.
Sample size: when a result starts to mean something
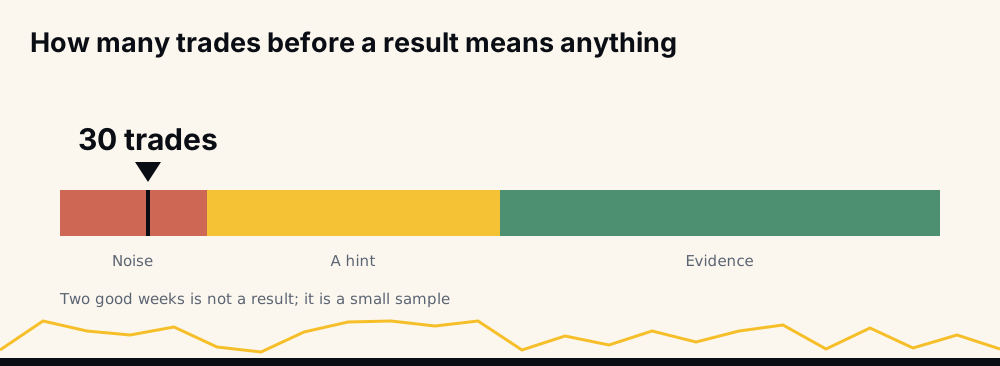
A great fortnight tells you almost nothing. So does a terrible one. With any realistic win rate, runs of five or six consecutive outcomes in either direction happen regularly, so a two-week sample is dominated by which run you happened to catch.
This cuts both ways, and it is why people abandon systems that were working and stick with ones that were not. Decide in advance how many trades you will evaluate over before drawing a conclusion, and hold to it — otherwise the decision gets made by whichever run you are currently living through.
Groups that cannot be profitable by construction
Some channels are not a bad bet; they are not a bet at all, because the record they present cannot correspond to a real trading result.
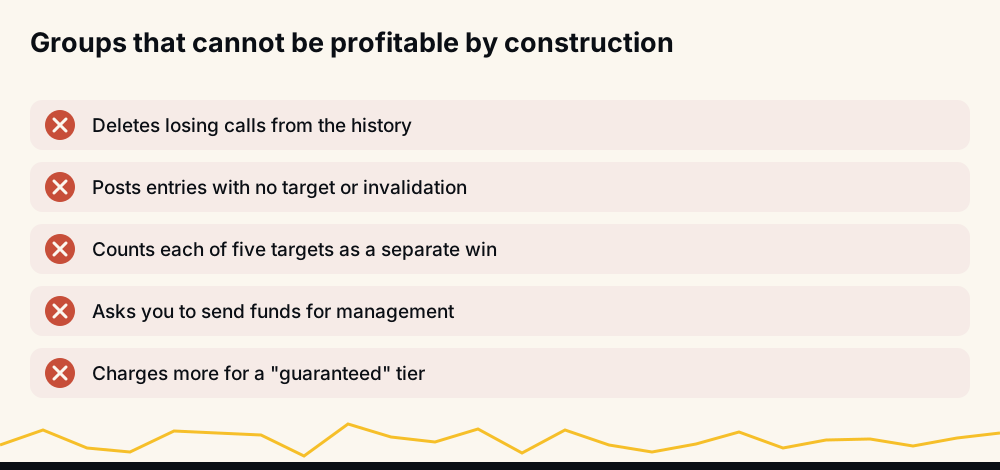
The third one is worth a note because it looks technical rather than dishonest. A call with five targets, where price reaches the first and reverses, gets recorded as a win — and if each target counts separately, the same trade can be recorded as several. A follower who held for the later targets got a loss out of what the channel logged as wins. When you see multi-target posts, ask which target the published rate assumes.
The last one, the "guaranteed" tier, ends the conversation entirely. Nobody controls the market, and a guarantee is a statement about the seller rather than about the strategy. The broader pattern is covered in telling legitimate Telegram bots from scams.
What actually decides whether you profit
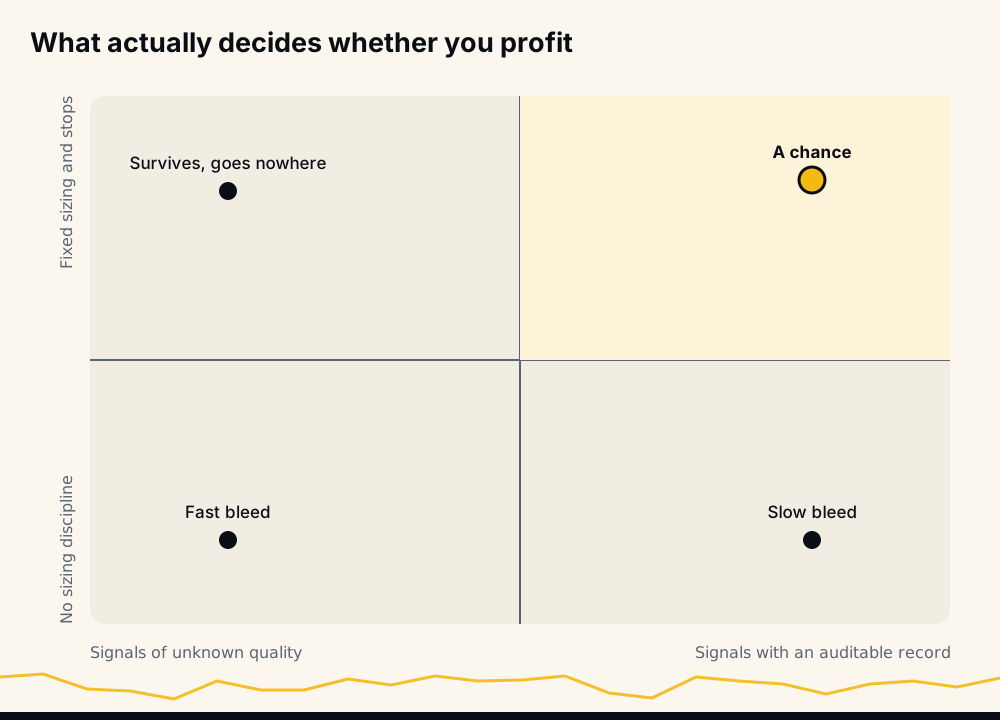
Note that discipline alone gets you "survives, goes nowhere" and good signals alone get you "slow bleed". Both are needed, and the discipline half is the one entirely within your control — which is a more useful place to spend effort than searching for a better channel.
What profitability looks like when it does happen
It is worth describing, because the expectation people arrive with is the reason many quit a working system.
A profitable month following signals rarely looks like a run of wins. It looks like a majority of small results in both directions, a handful of losses that were larger than felt comfortable, and two or three trades that carried the entire month. Remove those two or three and the month is flat or negative — which is normal, and is what a positive expectancy actually looks like in practice rather than in a marketing graphic.
It also does not look like a smooth line. Even a system with a genuine edge spends a lot of its time below its previous high, because drawdowns are the ordinary state of any strategy between new peaks. A follower expecting steady weekly gains will interpret an entirely healthy fortnight as failure and stop, usually somewhere near the bottom of the drawdown.
And the size of it is smaller than people expect. Compounding modest returns is how accounts grow; the alternative — sizing up to make the numbers feel meaningful — is the thing that removes accounts, as the reward-to-risk arithmetic above makes clear. Someone who follows signals well and grows an account steadily will find the result unexciting month to month, which is a poor sales pitch and an accurate description.
The practical implication is to decide what a successful outcome looks like before you start, in numbers, and to write it down. Judging as you go against a vague expectation of "making money" guarantees you will be disappointed during the periods when the system is behaving exactly as it should.
How to compute your own number
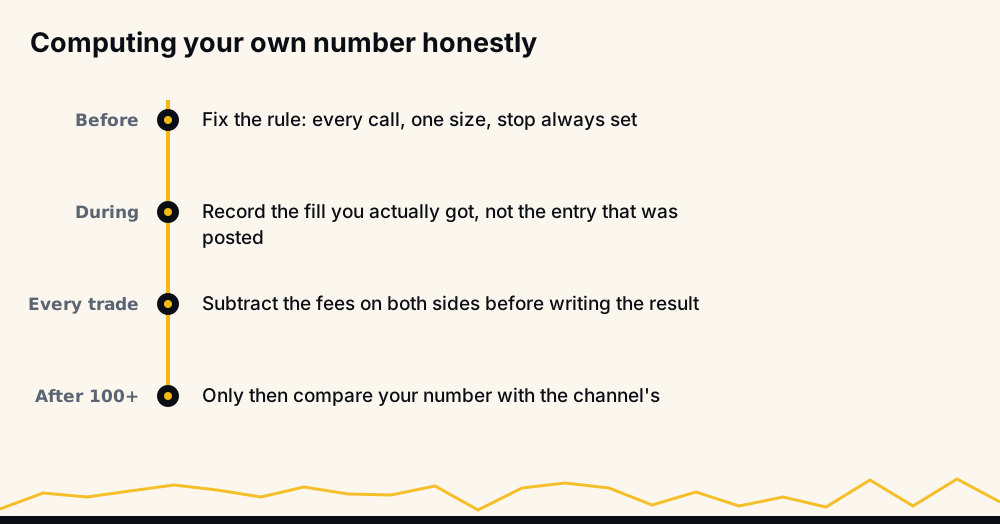
Do it on paper before doing it with money. The rules that keep the exercise honest:
- Every call, no exceptions. The moment you skip one, you are measuring yourself.
- One fixed size. Varying size makes the result depend on which trades you felt strongly about.
- The fill you would have got, including the delay you actually experience — not the posted entry.
- Fees subtracted per trade, both sides.
- A pre-committed sample length. Decide on 100 trades before you start, not after the first drawdown.
At the end you have a number that belongs to you. If it disagrees with the channel's, that disagreement is the most valuable information you will get about them.
What we publish, and what it does not promise
For our own signals: /reports holds 33 monthly spreadsheets covering June 2021 to February 2024, 33,694 signals, with a median monthly accuracy of 98.9% as reported in those sheets. Since June 2026, /performance has regenerated hourly from the trade database, where a win is the target being hit, a loss is the stop being hit, and an expiry — maximum hold reached with neither — counts against the hit rate. PnL is shown unleveraged. Losing months are published when they happen.
That is a record, not a forecast. It describes what the signals did, not what your account will do, and everything in this article about fills, fees, selection and sizing applies to following our signals exactly as it does to any other channel. The signals come from a model evaluating 240+ indicators, formulas and components across 500+ Binance USDT-M perpetual pairs; how it weighs them is proprietary, which is why the argument for it has to be the published outcomes rather than the method.
This is information, not investment advice. Trade only what you can afford to lose, and treat any single month — good or bad — as too small a sample to conclude anything from.
FAQ
Are crypto signal groups profitable? Some are, but a group being profitable and a follower being profitable are different claims. Fees, worse fills, skipped calls and inconsistent sizing routinely turn a positive channel into a negative account, so the only number that answers the question for you is one you computed from your own trades.
What is a realistic return from crypto signals? Nobody can quote you one honestly, because your return depends on your sizing, leverage, fees and which calls you take. Be sceptical of any specific figure offered up front — it describes a hypothetical follower who took every call perfectly and paid nothing to trade.
Why is my result worse than the signal group's? Almost always some combination of four things: you skipped calls, you filled at worse prices than the posted entries, you paid fees the channel did not count, and your position sizes varied. Fixing the sizing and taking every qualifying call closes most of the gap.
How many trades before I know if a signal group works? Well over fifty, and preferably more than a hundred. Runs of five or six consecutive wins or losses are normal at any realistic win rate, so shorter samples mostly measure which run you caught rather than the underlying quality.
Is a high win rate enough to be profitable? No. A win rate only means something alongside the reward-to-risk ratio: at 2:1, roughly 33% wins breaks even, while at 1:1 you need over half. A 90% win rate with tiny targets and distant stops can lose money, and a 55% one with good ratios can make it.
Do crypto signal groups count their losses? The honest ones do, and it is the fastest test. Scroll the channel for calls that went against them and check whether expirations are counted against the published rate rather than excluded from it — if losing calls are missing from the history, no figure derived from it means anything.